Tag: engineering drawings

  • What Is Design for Manufacturability (DFM) and How Does It Affect Your CAD Drawings?

    What Is Design for Manufacturability (DFM) and How Does It Affect Your CAD Drawings?

    10x  cost multiplier at each development stage for fixing the same manufacturing issue. A sketch-stage fix costs hours. A post-tooling fix costs months and six figures.
    1981  year the first DFM software was released on an Apple II Plus, offering real-time feedback to engineers. DFM as a discipline predates the modern CAD era.
    30-50%  typical quote price reduction achievable by applying DFM to sheet metal and machined parts before issue to suppliers (published fabrication industry data, 2026)
    Weeks to days  DFM review cycle time compression reported by CoLab AutoReview users by sharing designs with manufacturing and quality engineers simultaneously, without requiring CAD access

    Introduction:

    There is a particular type of engineering problem that happens quietly, costs a lot, and is almost entirely avoidable. An engineer spends three weeks building a detailed CAD model. The drawing is clean, well-dimensioned, and geometrically precise. It goes to the fabricator. A week later, the quote comes back with a price that is 40 percent higher than expected and a list of queries about features the machinist cannot make with standard tooling.

    Or worse: the drawing passes quoting, the parts are made, and the first batch comes back with features that are technically within drawing tolerance but functionally wrong because the drawing was not specific enough about what the manufacturing process needed to deliver.

    Both of these problems have the same root cause: the design was completed without Design for Manufacturability applied. The engineer knew what the part needed to do. They did not build the knowledge of how it would be made into the decisions that shaped the geometry, the tolerances, and the drawing notes.

    This guide explains what DFM is, how it changes the specific content of CAD drawings, what the most important rules are for each common manufacturing process, how tolerances should actually be allocated rather than how they usually are, what AI DFM tools are doing differently in 2026, and the ten mistakes that most consistently make parts expensive, slow, or wrong.

    Quick definition:  Design for Manufacturability (DFM) is the practice of designing parts and assemblies so they can be manufactured efficiently, at minimum cost, and without the defects that result from ignoring process constraints during design. Applied to CAD drawings, DFM changes how features are geometrically defined, how tolerances are allocated, and what notes and specifications the drawing must contain to produce a manufacturable part.
    What Is Design for Manufacturability (DFM) and How Does It Affect Your CAD Drawings
    DFM is not about making the drawing more complex. It is about making the geometry actually manufacturable.

    What Is Design for Manufacturability? The Clear Explanation

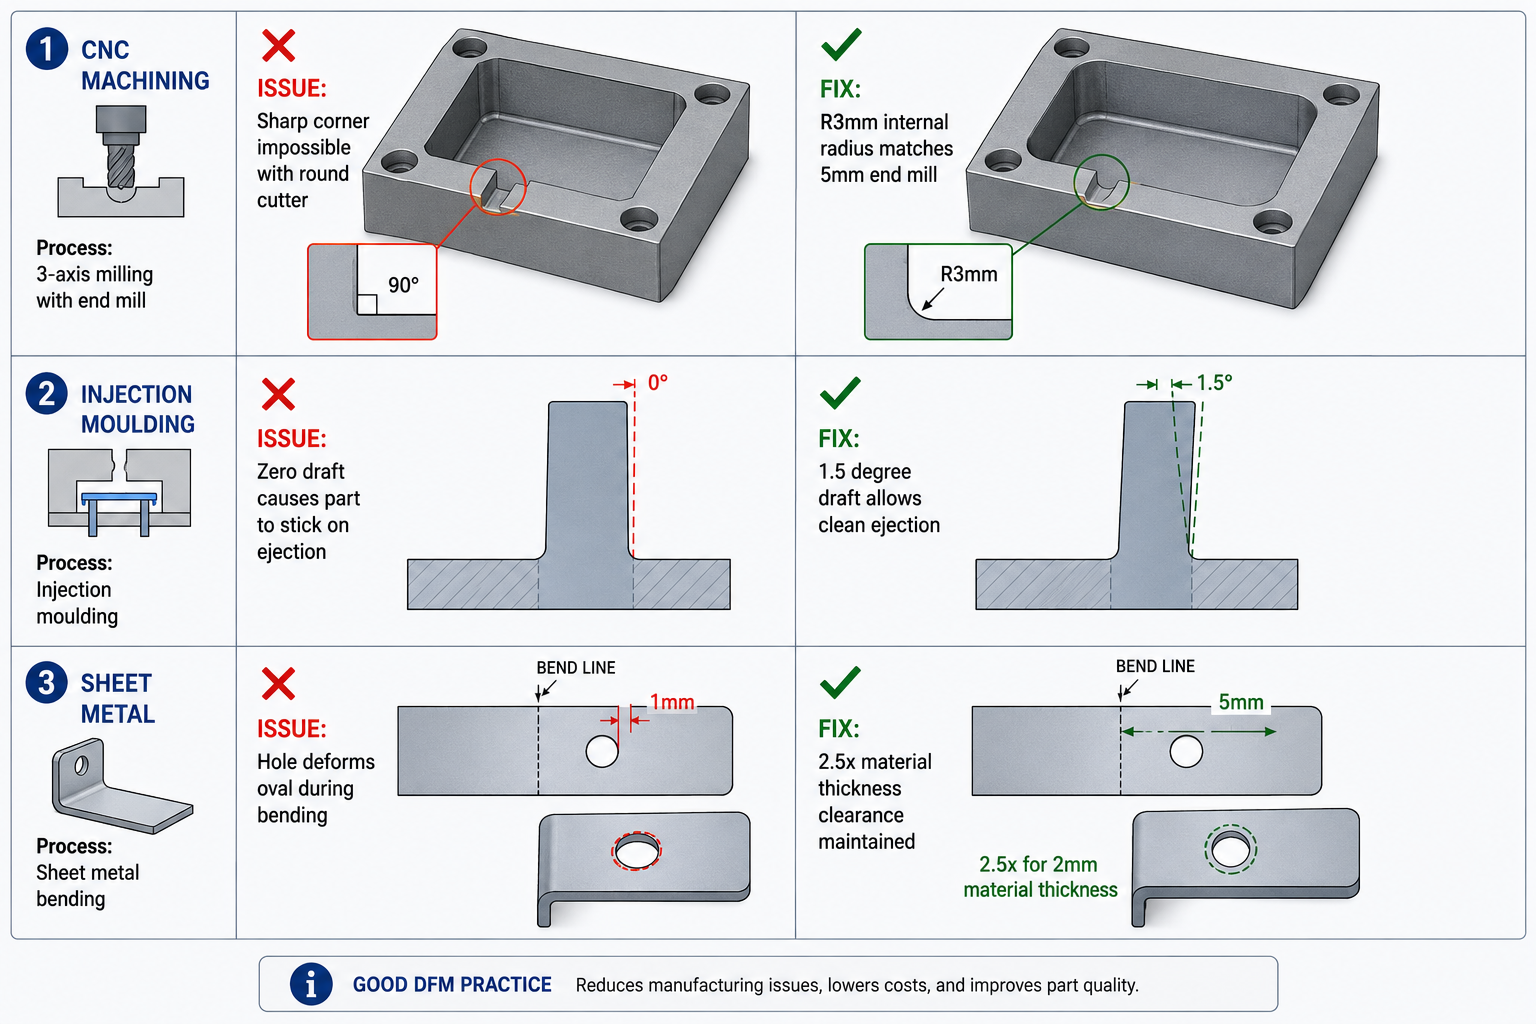
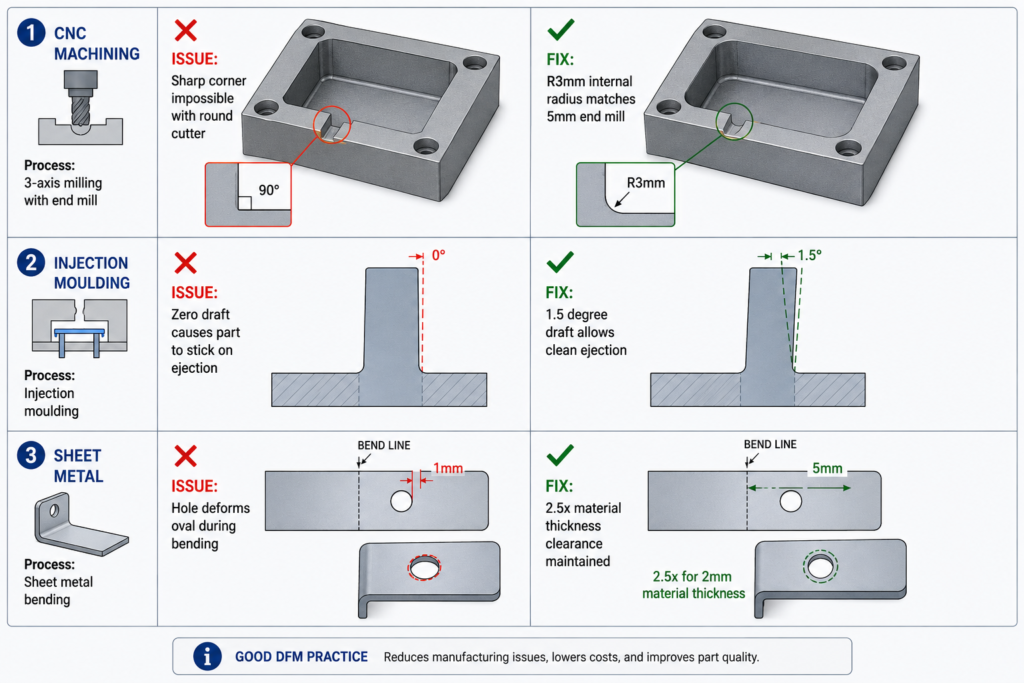
    The idea behind Design for Manufacturability is straightforward. Every manufacturing process has constraints. CNC milling cutters are round, so they cannot cut perfectly sharp internal corners. Injection moulds open and close in a single direction, so walls must have draft to release cleanly. Sheet metal presses bend material in a way that deforms nearby holes if they are too close to the bend line.

    DFM is the practice of knowing these constraints and designing around them from the start, rather than discovering them when the quote comes back with a problem list or when the first batch fails inspection. It is not a single review step at the end of the design process. It is a continuous mindset applied to every feature as the model is built.

    The core disciplines within the broader DFM umbrella include:

    • DFM (Design for Manufacturability): individual part geometry designed to be made efficiently by the target process
    • DFA (Design for Assembly): assemblies designed to be assembled with minimum parts, minimum operations, and mistake-proof orientations
    • DFMA (Design for Manufacture and Assembly): both combined, which is how most mature organisations approach the methodology
    • DFQ (Design for Quality): geometry and tolerances designed so that inspection and quality control are practical and reliable
    • DFS (Design for Sustainability): material selection and geometry designed for minimum material waste, energy use, and end-of-life disassembly

    This guide focuses on DFM in its most direct engineering application: how the manufacturing process a part will go through should determine the geometry, tolerances, and documentation of the CAD drawing that produces it.

    Why DFM Has Been Around Since 1981 and Still Gets Ignored

    The first DFM software was released in 1981 on an Apple II Plus. Boothroyd Dewhurst, Inc. was founded in 1983 to commercialise DFM and DFA methodology. The principles have been taught in mechanical engineering degrees for four decades. And yet, the most common feedback from manufacturing engineers reviewing designs from product engineers is still that basic DFM rules have not been applied.

    The reason is structural, not individual. In most product development workflows, the design engineer and the manufacturing engineer are separated by process, timeline, and sometimes by geography. The design engineer’s incentive is to get the design right functionally. The manufacturing engineer’s knowledge enters the process only at review gates that happen after significant design investment has been made. By the time a DFM problem is formally identified, it is expensive to fix.

    AI DFM tools in 2026 are beginning to solve this by giving the design engineer manufacturing feedback at the moment they are making the decisions that create the problem, not after those decisions are locked into a finished drawing.

    The Cost of Getting DFM Wrong: Why Early Matters So Much

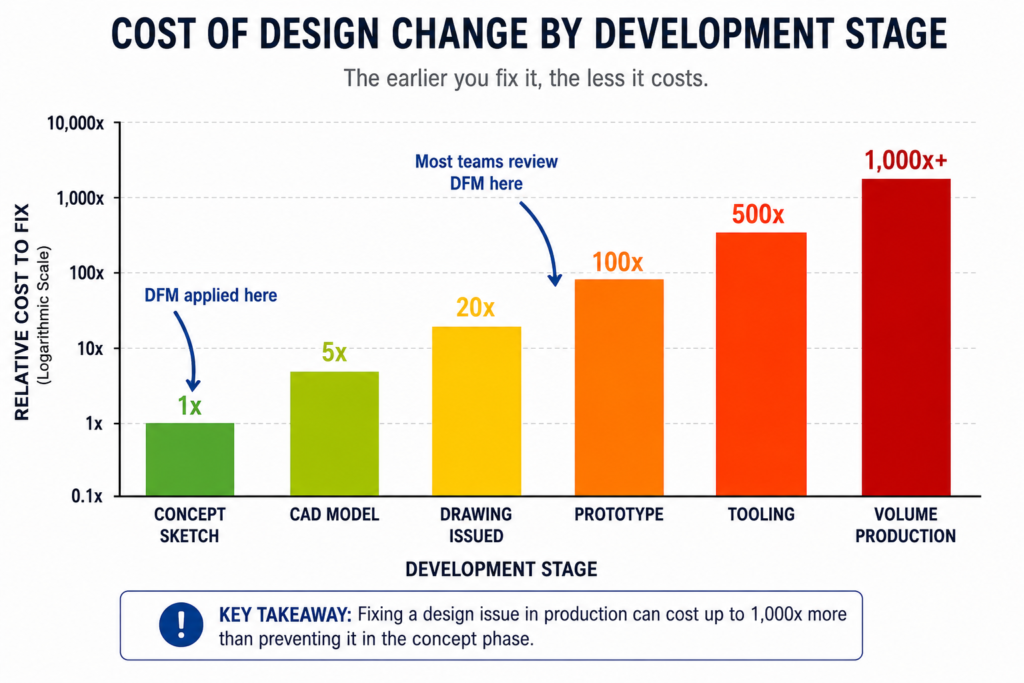
    The relationship between when a manufacturing problem is discovered and what it costs to fix it is not linear. It is exponential. Published data from the manufacturing industry consistently shows a ten times cost multiplier at each stage of the development process.

    StageWho catches the issueTypical correction costTime impact
    Concept / sketchDesign engineerNear zero: edit the sketchHours
    CAD model completeDFM review or tool$1,000 – $5,000Days to 1 week
    Drawing issuedManufacturer or DFM check$5,000 – $20,0001-3 weeks
    Prototype builtTesting team$20,000 – $100,000Weeks to months
    Tooling cut or orderedProduction engineer$50,000 – $500,000+Months
    Volume productionQuality / customer return$500,000 – millionsProgramme delay

    These are not theoretical figures. They reflect the actual economics of product development: engineering time to redesign, management overhead to approve the change, supplier communication to revise the order, scrapped tooling or scrapped parts, extended lead times, and in volume production, the cost of customer returns and warranty claims.

    The table makes the business case for DFM review at the concept stage self-evident. The cost of an engineering hour at concept is the same as at prototype. But an engineering hour at concept prevents a problem that would cost a hundred times more to fix at the same stage one step later in the process.

    The most common DFM timing mistake:  Treating DFM as a drawing release gate rather than a design activity. When DFM review only happens after the CAD model is complete and the drawing is drafted, every finding requires changes to finished work. The model must be reopened and edited. The drawing must be revised and re-checked. If DFM is instead applied feature by feature as the model is being built, the cost of each correction is essentially zero because the geometry does not yet exist in final form.
    Cost of Design Change by Development Stage Bar Chart
    DFM is not about adding cost to the design process. It is about avoiding the far larger costs that come when manufacturing problems are discovered late

    How DFM Directly Affects Your CAD Drawings: Element by Element

    The clearest way to understand how DFM in CAD works in practice is to look at specific drawing elements and compare how they appear with and without DFM applied. The differences are not cosmetic. They are the difference between a drawing that a manufacturer can confidently execute and one that generates a query list before production starts.

    Drawing ElementWithout DFM thinkingWith DFM applied
    Internal corner radiusSharp 90-degree corners on pocketed featuresMinimum radius callout matching available tool size
    Draft anglesVertical walls on moulded or cast parts1-3 degree draft on every wall with draw direction arrow
    TolerancesUniform tight tolerance on all featuresSelective: tight on functional interfaces, ISO 2768 elsewhere
    Wall thicknessVariable wall, thicker for stiffness, thinner for weightUniform wall, stiffness achieved through ribs and form
    Hole placementHoles positioned by assembly need aloneHoles checked against DFM rules for process before finalising
    Surface finishSingle Ra value across all surfacesSurface finish specified by zone: mating, sealing, general
    Material calloutNominal material grade, no processing specFull material spec with temper, condition, and standard reference
    Weld symbolsGeneric weld calloutProcess-specific: groove type, joint prep, inspection class
    GD&TAll dimensions in plus/minusGD&T applied at functional interfaces, datum structure defined
    NotesGeneric manufacturing notesProcess-specific notes: tool access, assembly sequence, inspection

    The Tolerance Conversation: What Most Engineers Get Wrong

    Tolerance over-specification is one of the most consistently expensive DFM failures, and one of the most consistently overlooked. When a drawing applies the same tight tolerance to every dimension regardless of whether that dimension affects function, the fabricator must either meet every tolerance at premium cost or query the drawing. Most of the time, tight tolerances are applied by default because the engineer did not consciously decide what each feature’s tolerance should be.

    The correct approach is selective tolerancing: apply tight tolerances only to features that genuinely require them for assembly or function, and let everything else default to a general tolerance standard like ISO 2768 medium (m). This approach communicates clearly to the fabricator what is critical and what is not, allowing them to prioritise process control where it matters and use their judgment elsewhere.

    Feature typeStandard tolerancePrecision toleranceWhen to specify precision
    Non-functional dimensionsISO 2768-mNot neededNever. Leave to process default.
    Mating clearance fitsISO 2768-mH7/g6 or similarWhen assembly requires controlled clearance
    Press fits / interferenceISO 2768-fH7/p6 or tighterWhen retention force is load-bearing
    Bearing seatsIT6-IT7 typicalIT5 for precisionAll rotating or oscillating bearing interfaces
    Sealing surfacesRa 1.6 surface finishRa 0.8 or 0.4All elastomeric or metal-to-metal seals
    Bolt clearance holesH12 or H13Not neededOnly for precise pin/dowel location
    General machined facesISO 2768-mAvoidGeneral form only, not functional mating
    Welded joint gapsPlus/minus 1.0mmPlus/minus 0.5mmOnly for precision structural weld joints
    The tolerance audit habit:  Before releasing any drawing, go through every toleranced dimension and ask one question: does the function of this part or assembly change measurably if this dimension is at the opposite end of its tolerance? If the answer is no, the tolerance is over-specified. Remove it or replace it with a general note reference. This single habit reduces manufacturing cost on most parts by 10 to 30 percent without changing function.

    DFM Rules by Manufacturing Process: What the Drawing Must Communicate

    The most important DFM knowledge for a design engineer is process-specific. The rules for CNC machining DFM are different from the rules for injection moulding, which are different from sheet metal, which are different from casting. The manufacturing process determines what the drawing must say, and a drawing that does not communicate the right things for its intended process is not a complete engineering document.

    Manufacturing ProcessKey DFM Rules for CADCommon CAD drawing violations
    CNC MachiningMin internal corner radius = tool radius + 10%. Max depth-to-width = 4:1 for slots. Uniform wall thickness. Limit setups to one or two sides.Sharp internal corners, pockets deeper than tool reach, features requiring 5-axis where 3-axis is spec
    Injection MouldingDraft angle 1-2 degrees on all walls. Min wall 1.2mm, uniform thickness. Rib height max 3x wall thickness. Gate location away from mating faces.No draft on tall walls, variable wall thickness causing sink marks, undercuts needing side actions
    Sheet MetalMin hole diameter = material thickness. Hole-to-bend distance = 2.5x thickness. Flange height = 4x thickness. Bend relief at intersecting bends.Holes too close to bends, flanges too short for press brake, no bend relief at corners
    Die CastingDraft 1-3 degrees. Wall uniformity critical. Parting line position chosen to minimise surface marks. Draft on cores and inserts.Non-uniform walls causing porosity, draft violations, undercuts on parting plane
    3D Printing (FDM)Orient to minimise supports. Min feature 2x nozzle diameter. Avoid horizontal overhangs beyond 45 degrees. Bridge length under 50mm without support.Features requiring excessive support, thin horizontal bridges, tolerance expectations beyond FDM capability
    Casting (sand/invest.)Min wall 3-5mm depending on alloy. Generous draft 2-5 degrees. Avoid sharp transitions, use fillets everywhere. Core placement feasibility.Thin sections that cannot fill, missing draft, sharp corners causing stress concentration in casting
    Welded fabricationAccess for welding torch and visual inspection. Joint gap specification. Weld sequence to minimise distortion. Avoid welds in high-stress zones.No access for torch, joints requiring simultaneous multi-position welding, tolerance on welded geometry too tight
    Turning / lathe workConsistent diameters to minimise tool changes. Undercuts need relief groove. Chamfers on all transitions. Length-to-diameter max 4:1 without steady.Long slender parts with no steady provision, multiple non-standard diameters, undercuts without relief

    CNC Machining DFM: The Internal Corner Is Where It Always Breaks

    The single most common CNC machining DFM violation is the sharp internal corner in a pocketed feature. A milling cutter is round. It cannot cut a 90-degree internal corner. It leaves a radius equal to its own radius. If the design requires a sharp corner, either a different operation is needed (EDM wire cutting, broaching, or grinding), or the part cannot be made as drawn.

    The solution is not complicated: specify a minimum internal corner radius in every pocketed feature, equal to the cutter radius plus ten percent clearance. For a 10mm end mill, specify R6mm internal corners. For a 6mm end mill, R4mm. If the mating part that fits into the pocket has a sharp corner, chamfer or relieve that part’s corner rather than requiring the pocket to be square.

    The second most common issue is feature depth relative to available tooling. Standard end mills have a flute length to diameter ratio of around 3:1 to 4:1. A pocket 60mm deep requiring a 10mm end mill cannot be machined with standard tooling because the flute length is only 30 to 40mm. The feature requires special extended-reach tooling, which adds cost, delivery time, and vibration risk to the operation. If the pocket depth is driven by function, acknowledge in the notes that extended tooling is required and confirm with the machinist before releasing.

    Injection Moulding DFM: Draft and Wall Thickness Are Not Optional

    Draft angle is the first and most critical injection moulding DFM rule. When a part is injected into a mould, it must be ejected cleanly as the mould opens. Without draft on the walls, the part grips the mould and either damages the surface, requires excessive ejection force that marks the part, or sticks entirely. The minimum draft angle depends on the surface finish: polished surfaces require at least 0.5 degrees, textured surfaces require 3 to 5 degrees in addition to the texture depth.

    Wall thickness uniformity is the second critical rule. Injection-moulded parts cool from the outside in. Thick walls cool slowly, thin walls cool quickly. Where thick and thin sections meet, the differential cooling creates internal stress, sink marks on the surface opposite the thick section, and warping as the part cools unevenly. The DFM-compliant approach is to design uniform wall thickness throughout and use ribs and gussets to add stiffness, not increased wall thickness.

    Rib design follows specific proportions from the wall: rib height maximum 3 times the wall thickness, rib thickness 50 to 60 percent of the wall thickness, and a draft of 0.5 to 1 degree on each rib face. These proportions prevent the rib from causing sink marks on the visible face while providing the stiffness that the design requires.

    Sheet Metal DFM: The Rules That Are Invisible Until You Break Them

    Sheet metal DFM rules are covered in depth in our guide on sheet metal design for manufacturing. The most consequential rules that affect CAD drawings specifically are the hole-to-bend distance (minimum 2.5 times material thickness from the hole edge to the nearest bend tangent line), the flange height minimum (4 times material thickness for press brake grip), and the requirement for bend relief cuts at all intersecting bends.

    These rules are invisible on the finished drawing to anyone who does not know them. A hole positioned 3mm from a bend in 2mm steel looks like a standard hole. The drawing does not announce that it will deform oval during bending. The experienced fabricator will query it. The inexperienced one will cut it and discover the problem at forming.

    AI DFM Tools in 2026: From Rule Checkers to Active Design Optimisers

    The AI DFM tool landscape in 2026 has split into two distinct categories: tools that check designs against rules and flag problems, and tools that actively optimise designs against manufacturing constraints without requiring the engineer to make every correction manually. Understanding the difference helps set realistic expectations about what each tool can deliver.

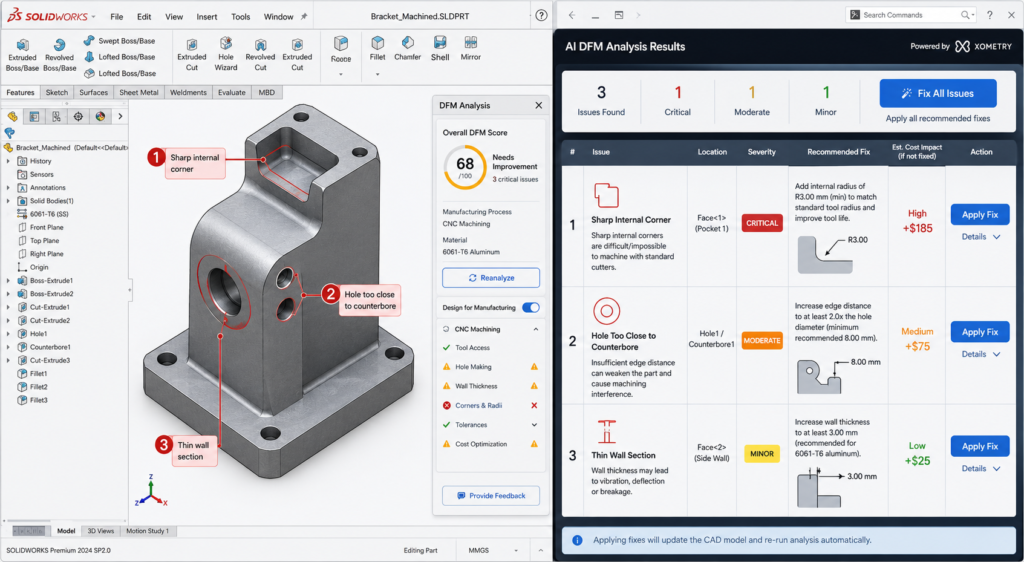
    AI DFM Analysis Interface Real-Time Feedback on CAD Model
    I DFM tools in 2026 flag issues as you model, not after the drawing is released. The fix takes seconds. The same fix after tooling takes months.
    ToolTypeWhat it checksCAD integration
    Xometry DFMCloud / uploadCNC, 3D printing, injection mouldingSTEP upload, instant feedback online
    CoLab AutoReviewCollaboration AIBest practices, company-specific standardsComment on 3D models in browser, no CAD needed
    InfinitFormIn-CAD AIActively optimises geometry, not just flagsDirect Fusion 360 and SolidWorks integration
    Autodesk DFM (Fusion)In-CAD integratedMachining, additive, sheet metalNative in Fusion 360 Manufacture workspace
    DFMXpressIn-CAD integratedMachining and injection moulding rulesNative in SolidWorks, runs on active model
    Dashnode AI DFMCloud / uploadCNC, turning, sheet metal, additiveSTEP/IGES upload, detailed feature-level report
    Protolabs DFMCloud / uploadInjection moulding, machining, 3D printingPart upload on quoting platform
    Fictiv DFM feedbackCloud / uploadAll common processes with manufacturabilityIntegrated in quoting and ordering workflow

    Static Rule Checkers vs AI-Driven Optimisers

    Traditional DFM tools, including the built-in DFMXpress in SolidWorks and early versions of cloud upload tools, apply static geometric rule sets. The rules are hard-coded: minimum corner radius, minimum draft, minimum hole diameter. When a feature violates a rule, the tool flags it. The engineer decides what to do.

    The limitation identified in a March 2026 CoLab analysis is that static rule checkers often generate high volumes of false positive alerts on designs that are technically acceptable for the specific tooling and process setup being used, even if they violate a generic rule. Engineers begin ignoring the alerts because too many are irrelevant. The signal-to-noise ratio degrades the value of the tool.

    AI-trained tools like InfinitForm and the newer generation of analysis engines trained on real manufacturing outcomes are beginning to address this. Rather than applying static geometric rules, they are trained on historical manufacturing data: which designs were quoted at a premium, which resulted in scrap, which required tool changes or process deviations. The feedback is contextual rather than generic, which reduces false positives and increases engineer trust in the outputs.

    InfinitForm: The Active Optimiser Approach

    InfinitForm represents a conceptually different approach from flagging tools. Rather than producing a list of problems for the engineer to solve, it applies automated geometry corrections directly to the CAD model: rounding corners, adding draft, adjusting wall thickness, all within the CAD environment without requiring the engineer to identify and manually fix each issue.

    For engineering teams processing high volumes of similar part geometries, this approach delivers significant throughput gains. For complex or novel designs where the engineering judgment behind each feature is important, the active optimiser approach needs careful supervision: automated corrections can change the design intent if the optimiser does not understand why a specific geometry exists. The engineer remains responsible for reviewing what the tool has changed.

    Cloud Upload Tools: Xometry, Protolabs, and Fictiv

    The cloud quoting platforms operated by Xometry, Protolabs, and Fictiv have built DFM analysis directly into their quoting workflow. When an engineer uploads a STEP file for a quote, the platform analyses the geometry against the selected process rules and returns both a price and a DFM report in the same response.

    This is probably the most consequentially positioned DFM feedback in any workflow: the engineer receives manufacturing feedback at the exact moment they are deciding whether to proceed with the design. A DFM issue flagged at the quoting stage costs an email and a model revision. The same issue discovered during production at that same supplier costs a production hold and an emergency re-design.

    Design for Assembly: The DFM Dimension That Affects the Whole Product

    If DFM focuses on how individual parts are made, Design for Assembly (DFA) focuses on how those parts come together. The principles are related but distinct, and both have direct effects on what appears on CAD drawings and assembly documentation.

    The Boothroyd-Dewhurst Principles That Still Apply in 2026

    Geoffrey Boothroyd and Peter Dewhurst codified the foundational DFA principles in the 1970s and 1980s. Four decades later, they remain the most consistently useful framework for assembly design decisions in CAD:

    1. Minimise the part count. Every part is a cost: material, manufacturing, inspection, inventory, and assembly time. Ask whether each part can be combined with an adjacent part without losing function. The part count is the single highest-lever driver of assembly cost.
    2. Design parts with unambiguous assembly orientation. If a part can be inserted in the wrong orientation, it will be, eventually, and the consequence will be a field failure or an assembly line stoppage. Use asymmetric geometry or assembly features to make the wrong orientation physically impossible.
    3. Design for top-down assembly. Where possible, design assemblies so each part is added from above and drops into place under gravity. This enables robotic assembly and reduces the number of repositioning steps required during manual assembly.
    4. Minimise fastener count and types. Each different fastener type requires a different tool, a different bin, and a different training requirement. Standardise on a minimum number of fastener types and sizes across a product family.

    How DFA Appears in CAD Drawings

    • Poka-yoke features (asymmetric tabs, locating pins, orientation notches) that make wrong assembly physically impossible
    • Assembly sequence notes specifying the order of sub-assembly and final assembly operations
    • Fastener callouts using the minimum number of standardised types across the assembly
    • Clearance specifications for assembly tool access (screwdriver, spanner, rivet gun)
    • Datum references that are accessible and measurable during assembly, not just during inspection

    Integrating DFM Into Your CAD Modeling Workflow

    DFM is most effective when it is not a separate activity from CAD modeling but a habit embedded in how the model is built. The following approach integrates DFM thinking at each stage of the modeling process without adding a separate review gate that is often compressed or skipped under schedule pressure.

    Before Opening the CAD Software

    The most important DFM decision is often the first one: selecting the manufacturing process. The process determines every subsequent DFM rule that applies. A design engineer who does not know whether a part will be machined, moulded, or fabricated cannot make any sensible geometry decisions because the constraints are completely different for each.

    If the process is not yet fixed, the concept design should use geometry that is agnostic enough to work for at least two candidate processes. Do not design sharp internal corners as a default if the part might be injection moulded, because adding draft later is more disruptive than designing with draft from the start. Use the concept stage to test which process is most appropriate before committing to the geometry that locks the choice.

    During Feature Creation

    Apply the most critical DFM rule for the chosen process to each feature as it is created. For machined parts: never create an internal pocket without specifying the corner radius in the feature. For moulded parts: apply draft before finalising any extruded wall. For sheet metal: check hole-to-bend clearance before placing any hole near a fold line.

    This is not additional work. It is the same modeling time applied with process awareness rather than pure geometry focus. The feature takes the same time to create. The only difference is whether the geometry that is created will need to be reopened and corrected when the DFM check is run after drawing completion.

    At Drawing Creation

    The drawing is where DFM is either confirmed or undermined by tolerances and notes. Three things matter most at the drawing stage.

    First, tolerance allocation: apply the tolerance table approach from earlier in this guide. Tight only where function requires it. General reference everywhere else. Add a general tolerance block in the title block referencing ISO 2768-m so the fabricator knows the default.

    Second, drawing notes: add process-specific notes that the drawing geometry alone cannot communicate. Tool access direction for inspection. Acceptable substitution materials if the primary specification is unavailable. Required testing before acceptance. Any feature that is critical to assembly or safety, marked as such.

    Third, run the AI DFM check before releasing. With tools like DFMXpress in SolidWorks or the Fusion 360 DFM workspace, this takes minutes and catches the geometric violations that might have slipped through modeling. Treat any critical finding as a mandatory fix, not an optional consideration.

    10 DFM Mistakes That Make Parts Expensive, Slow, or Wrong

    These are the DFM failures that come up most consistently across machined, moulded, and fabricated part reviews. Each one has a specific, measurable cost consequence and a straightforward prevention strategy.

    MistakeCost consequencePrevention
    Sharp internal corners in CNC pockets100% rejection or EDM rework: $500-$5,000/partSpecify minimum internal radius = tool radius + 10% in all pocketed features. Put it in the drawing notes.
    No draft on injection-moulded wallsMould tools reworked or part sticks on ejectionApply 1-2 degree draft to all walls in draw direction. Check mould flow simulation before tooling.
    Over-toleranced non-critical featuresQuote 30-50% higher than necessaryApply ISO 2768-m as default. Tighten only mating and functional interfaces. Mark critical dimensions clearly.
    Variable wall thickness in mouldingSink marks, warping, weld lines in productionDesign uniform wall thickness. Add ribs for stiffness. Transition thickness changes with tapered sections.
    Undercuts without side actions budgetedTooling cost overrun by 20-40%Identify all undercuts during DFM review and confirm whether side actions are in tooling budget and lead time.
    Material specified without temperWrong material properties, wrong machinabilityAlways specify full material standard: alloy, grade, temper, condition. Not ‘aluminium’ but ‘6061-T6 per AMS 2770’.
    Feature depth exceeding tool reachSpecial tooling ordered, programme delayedCheck all pocket depths against standard end mill reach ratios (max 4:1 depth:diameter for standard tooling).
    No tool access for inspectionIn-process inspection impossible, defects missedDesign inspection access for all critical features. Confirm measurement method with quality team before drawing release.
    Assembly sequence not consideredParts cannot be assembled in the designed orderBuild assembly sequence into notes. Check that every fastener has access and every sub-assembly can reach its position.
    Ignoring DFM until drawing is completeRework of finalised model is expensive and slowIntegrate DFM checks at the concept and mid-model stage, not as a gate after the drawing is finished.
    The DFM checklist for every drawing release:  Before releasing any CAD drawing: (1) Internal corner radii specified for all machined pockets. (2) Draft angles on all moulded or cast walls. (3) Wall thickness uniform or tapered for injection moulding. (4) Hole positions checked against bend distances for sheet metal. (5) Tolerance callouts reviewed, non-critical features set to ISO 2768-m. (6) Full material specification including temper and standard. (7) AI DFM check run and all critical findings resolved. (8) Assembly sequence and tool access confirmed where relevant. Two minutes of checking here prevents two weeks of rework later.

    DFM and Sustainability: The 2026 Dimension

    Sustainability-focused DFM is the fastest-growing component of the discipline in 2026. Regulatory pressure, customer expectations, and genuine cost savings from material efficiency are driving its adoption in sectors from consumer electronics to industrial equipment.

    Sustainability-focused design for manufacturability applies the same logic as cost-focused DFM: the design decision made at the CAD stage determines the material waste, energy consumption, and end-of-life recyclability of every part produced. Those outcomes cannot be improved significantly once the geometry is fixed and tooling is committed.

    • Material efficiency: topology-optimised geometry removes material from low-stress regions, reducing both part weight and the energy required to produce the raw material
    • Process selection for carbon footprint: machining from solid generates significant swarf waste; near-net-shape forming processes such as forging and casting use materially less input stock for the same output part
    • Fastener-free joining: snap-fit, press-fit, and adhesive-bonded joints reduce the number of dissimilar materials in an assembly, improving recyclability at end of life
    • Recycled material specification: calling out recycled aluminium alloys or post-consumer recycled polymer grades in the material specification is now a viable and often cost-neutral choice on many standard part types
    • Design for disassembly: ensuring that assembled parts can be separated at end of life without destroying either component, by avoiding permanent bonding of dissimilar materials and designing accessible fastener access

    Conclusion:

    The engineers who produce drawings that go directly to manufacture without a problem list are not the ones with the most experience. They are the ones who have internalised the constraints of the processes they are designing for, and who apply those constraints feature by feature as the model is built rather than as a checklist after it is finished.

    Design for Manufacturability is not complicated. The rules for each process are learnable in an afternoon. The tolerance strategy is a decision framework, not a table to memorise. The DFM habits, checking corner radii in machined pockets, adding draft to moulded walls, keeping holes away from bends, take no additional time once they are reflexive.

    What makes DFM expensive to ignore is the compounding cost of discovering problems late. What makes it worth prioritising is the compounding benefit of designs that work the first time: faster first article acceptance, fewer supplier queries, lower quoted prices, and manufacturing teams that trust the drawings they receive.

    In 2026, AI DFM tools from InfinitForm, Xometry, CoLab, and others are making it easier to catch the remaining violations that slip through even experienced design reviews. But the tools only work well on designs that were already being thought about correctly. The AI catches what the engineer missed. It does not replace the engineer thinking about manufacturability while the model is being built.

    Design the process into the part. The process cannot be designed in after the drawing is released.

    Frequently Asked Questions

    What is design for manufacturability (DFM)?

    Design for manufacturability (DFM) is an engineering methodology that ensures products are designed to be manufactured efficiently, reliably, and at minimum cost. It involves applying process-specific design rules during CAD modeling, reviewing geometry against manufacturing constraints before drawings are released, and selecting materials and tolerances that match what the production process can actually achieve. DFM reduces rework, scrap, and tooling corrections by catching problems at the design stage rather than on the shop floor.

    How does DFM affect CAD drawings specifically?

    DFM changes what a CAD drawing must communicate. A DFM-compliant drawing includes minimum internal corner radii that match available tooling, draft angles on moulded and cast walls, hole-to-bend distances for sheet metal, and selective tolerances that are tight only on functional interfaces while leaving the rest to ISO 2768 defaults. The manufacturing process determines what the drawing must say. Without DFM applied, drawings routinely specify features that are impossible for the intended process, tolerances that add cost without functional benefit, and geometry that a fabricator must query or reject.

    When in the design process should DFM be applied?

    DFM should be applied at the concept stage, before detailed CAD modeling begins. The cost of fixing a manufacturing issue increases by roughly a factor of 10 at each development stage. Fixing a DFM issue at concept costs engineering time only. The same problem found after tooling is cut costs tens of thousands to hundreds of thousands of dollars and delays the programme by months. The most effective DFM is not a gate review at drawing completion but a continuous habit of checking each feature against the target process as the model is built.

    What are the most important DFM rules for CNC machining?

    The most critical DFM rules for CNC machining in CAD are: minimum internal corner radius equal to the cutter radius plus ten percent, maximum pocket depth to width ratio of 4:1 for standard tooling, uniform wall thickness to avoid chatter and deflection, feature access from two setups maximum, chamfers rather than sharp edges on all transitions, and thread relief grooves on all threaded sections. Each of these rules is directly reflected in how the part is dimensioned and annotated on the drawing.

    What is the difference between DFM and DFA?

    DFM (Design for Manufacturability) focuses on how individual parts are made. DFA (Design for Assembly) focuses on how parts are assembled together. DFM asks whether a single part can be manufactured efficiently by the intended process. DFA asks whether the number of parts can be reduced, whether fasteners are accessible, whether parts can be assembled in only one orientation, and whether the assembly sequence is practical. Both disciplines are related and both affect CAD drawings, but they address different failure modes in product development.

    How does AI DFM analysis work in 2026?

    AI DFM tools in 2026 analyse CAD geometry automatically when a model is uploaded or as it is being built inside the CAD environment. They check features against process-specific rule libraries, flag violations with location, severity, and suggested fix, and in the most advanced tools such as InfinitForm, they automatically optimise the geometry rather than simply flagging the problem. Tools like Xometry and Protolabs integrate DFM feedback directly into the quoting workflow, so engineers receive manufacturability feedback at the same time as they receive a price. The shift from static geometric rules to AI trained on manufacturing outcomes is making DFM analysis faster, more accurate, and more accessible to engineering teams without dedicated DFM specialists.


    Boothroyd Dewhurst: the founding research organisation for DFMA methodology

  • Piping and Instrumentation Diagrams (P&IDs): What They Are and How to Read Them

    Piping and Instrumentation Diagrams (P&IDs): What They Are and How to Read Them

    ISA 5.1-2024  latest revision of the dominant global P&ID instrumentation standard, reaffirmed with updated tagging conventions for modern DCS and SIS systems
    100-300+  typical P&ID sheet count for a single process unit, compared to 10-30 sheets for the equivalent Process Flow Diagram
    5 letters  maximum tag length in the ISA 5.1 system: first letter (measured variable) plus up to four modifier and function letters
    Life of plant  P&IDs are living documents maintained from FEED through decommissioning, unlike most engineering drawings that are frozen at handover

    Introduction:

    If a process plant has one drawing that every engineer, operator, and maintenance technician needs to understand, it is the piping and instrumentation diagram. Walk into any control room in any refinery, chemical plant, water treatment facility, or pharmaceutical manufacturing site and you will find P&IDs on the wall, on screens, and in the hands of the people running the plant.

    A P&ID is not a photograph of the plant. It is not a pipe routing drawing. It is not a process overview. It is something more specific and more useful than any of those: it is the complete schematic record of every pipe, every valve, every instrument, and every control connection in a process system, drawn in a standardised symbolic language that anyone trained in the conventions can read, regardless of which plant they are working in or which language they speak.

    This guide explains what a P&ID drawing actually contains, how to decode the instrument tag system, what the different symbol shapes mean, how to trace a control loop from measurement to output, and where P&IDs fit in the wider family of process engineering documents. It also covers the most common reading mistakes and where digital P&IDs are heading in 2026.

    Quick definition:  A P&ID (Piping and Instrumentation Diagram) is a schematic engineering drawing that shows every pipe, valve, instrument, and control element in a process system. It includes pipe sizes and material specifications, valve types and locations, instrument tags following the ISA 5.1 standard, control loops, and safety systems. P&IDs are used for design, construction, operations, and maintenance throughout the life of a plant.
    Piping and Instrumentation Diagrams (P&IDs): What They Are and How to Read Them
    Every element on a P&ID has a precise meaning. None of it is decoration.’

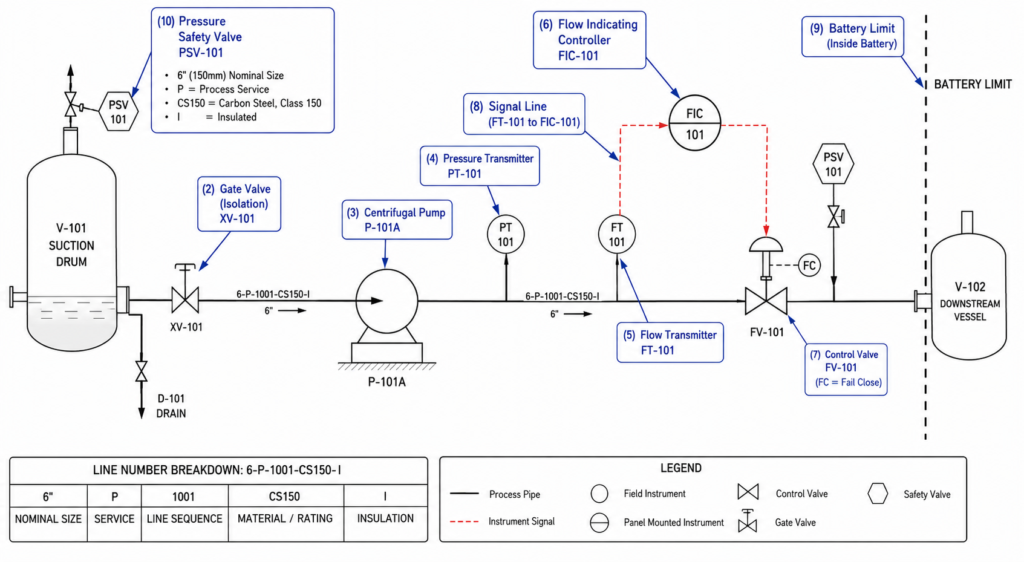
    What Is a P&ID? The Complete Explanation

    A P&ID is a schematic drawing. That single word, schematic, is the key to understanding what it is and what it is not. It shows logical and functional connections between process elements, not their physical positions in the plant. Two pipes shown crossing on a P&ID may be 20 metres apart in reality. A pump shown next to a vessel may have 50 metres of pipework between them on site. The P&ID is not concerned with distance or physical layout.

    What it is concerned with is completeness and accuracy of what is connected. Every valve, no matter how small. Every instrument, no matter how minor. Every control signal, every safety device, every isolation point. If it exists in the process system, it appears on the P&ID.

    What a P&ID Contains

    • All process piping with line numbers that encode pipe size, service, material specification, and insulation requirement
    • Every valve shown by type (gate, globe, ball, butterfly, check, control, safety) with its tag number
    • All process equipment shown schematically: pumps, compressors, vessels, heat exchangers, columns, reactors
    • Every instrument with its ISA tag number identifying what it measures and what function it performs
    • All control loops showing the connection from measurement through controller to final control element
    • Safety systems including pressure safety valves, bursting discs, emergency shutdown valves, and interlocks
    • Utility connections showing how steam, cooling water, instrument air, and nitrogen connect to process equipment
    • Battery limits showing where this drawing’s scope ends and the adjacent drawing or system begins

    What a P&ID Does NOT Contain

    • Physical pipe routing or dimensioned layout (that is the isometric drawing)
    • Structural supports, building walls, or topographic information
    • Equipment dimensions or installation details (those are equipment general arrangement drawings)
    • Electrical wiring detail (that is the electrical schematics and loop drawings)
    • Accurate spatial relationships between any components

    These exclusions are not limitations. They are the reason P&IDs are so useful. By removing all spatial and dimensional information, the drawing focuses entirely on what matters for process understanding, operations, and maintenance: what exists, how it connects, and how it is controlled.

    P&ID vs PFD: Understanding Where Each Drawing Fits

    The most common source of confusion when engineers and operators first encounter process plant documentation is the relationship between the Process Flow Diagram and the P&ID. They look superficially similar but serve entirely different purposes.

    AspectProcess Flow Diagram (PFD)P&ID
    Level of detailHigh-level process overviewEvery pipe, valve, and instrument
    Pipe informationMajor flows only, no sizesAll pipes with size, spec, tag number
    Valve detailMajor control valves shownEvery valve by type and tag
    Instrument detailKey measurements onlyEvery instrument with tag and loop
    Safety systemsNot shownPSVs, ESDs, interlocks all shown
    Who uses itProcess engineer, project managementAll engineering disciplines, operations, maintenance
    When producedEarly FEED and front-end designDetailed design through plant life
    For operations useNot appropriate for field usePrimary reference for operators
    For maintenance useNot appropriateIsolation planning, lockout/tagout
    Drawing count (typical)10-30 sheets for a process unit100-300+ sheets for same unit

    A useful way to think about the relationship: the PFD tells you what the process is supposed to do. The P&ID tells you everything that exists to make it do that. If someone asks why a certain pump is installed, the PFD gives the process logic. If someone asks which valves to close to isolate that pump for maintenance, the P&ID provides the answer.

    How to Read P&ID Instrument Tags: The ISA 5.1 System

    Every instrument on a P&ID has a tag number. That tag is not arbitrary. It follows a precise coding system defined by ANSI/ISA 5.1, the international standard for instrumentation symbols and identification last revised in 2024. Once you understand the system, you can decode any instrument tag on any P&ID drawn to this standard, in any plant, anywhere in the world.

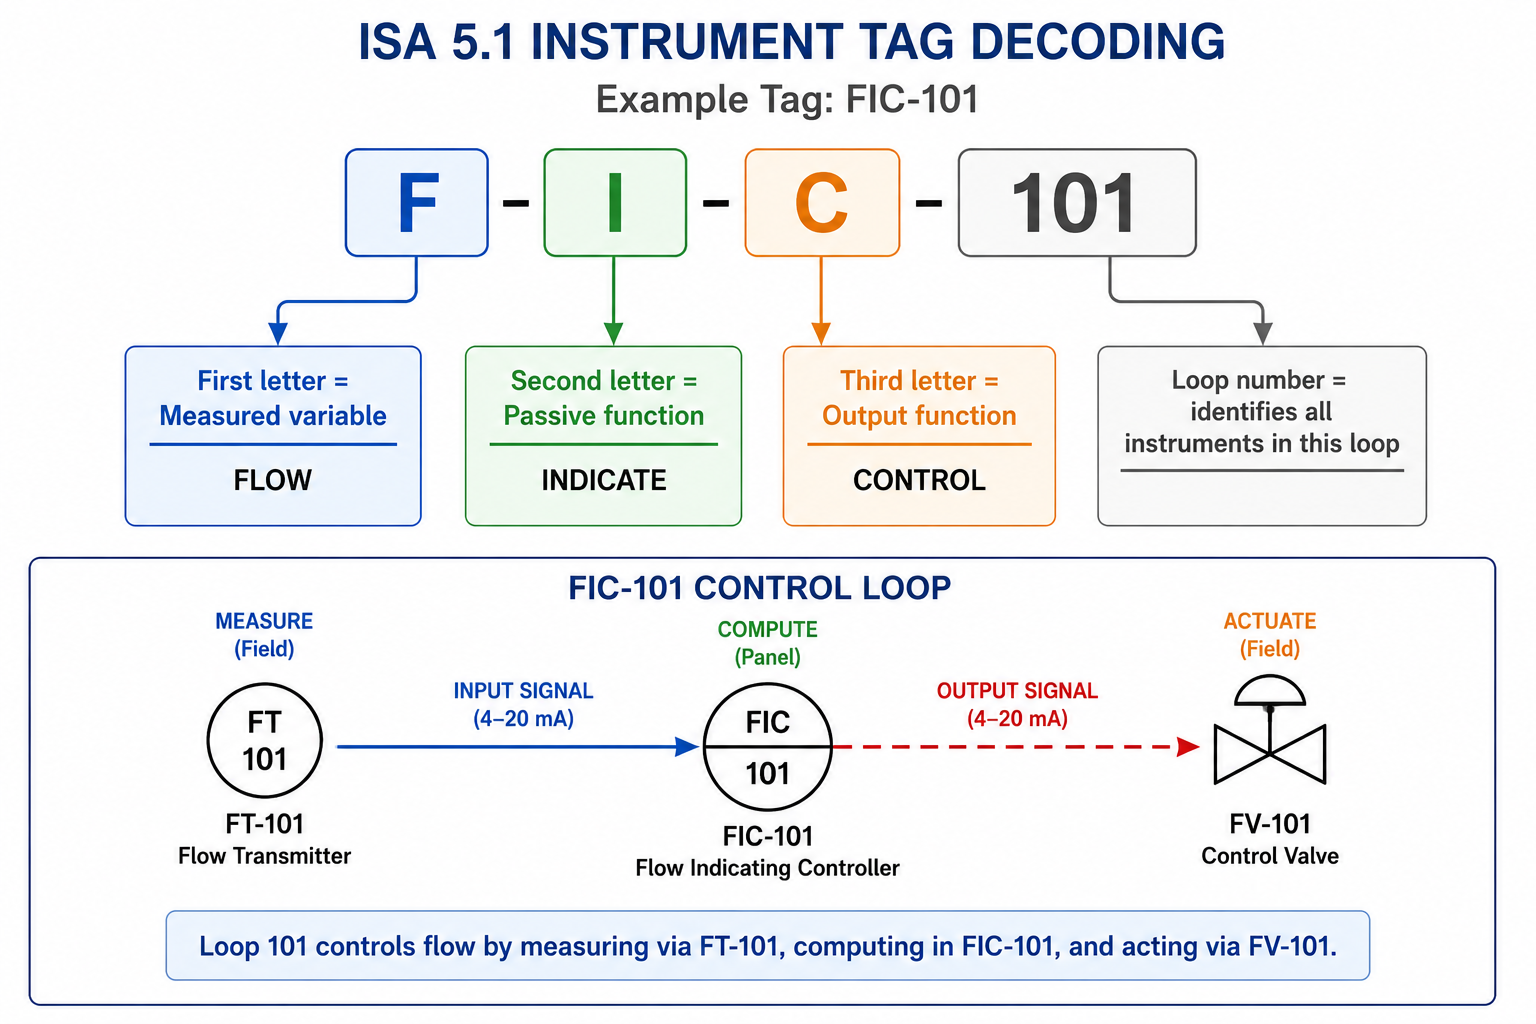
    ISA 5.1 tag decoding and control loop

    The Tag Structure

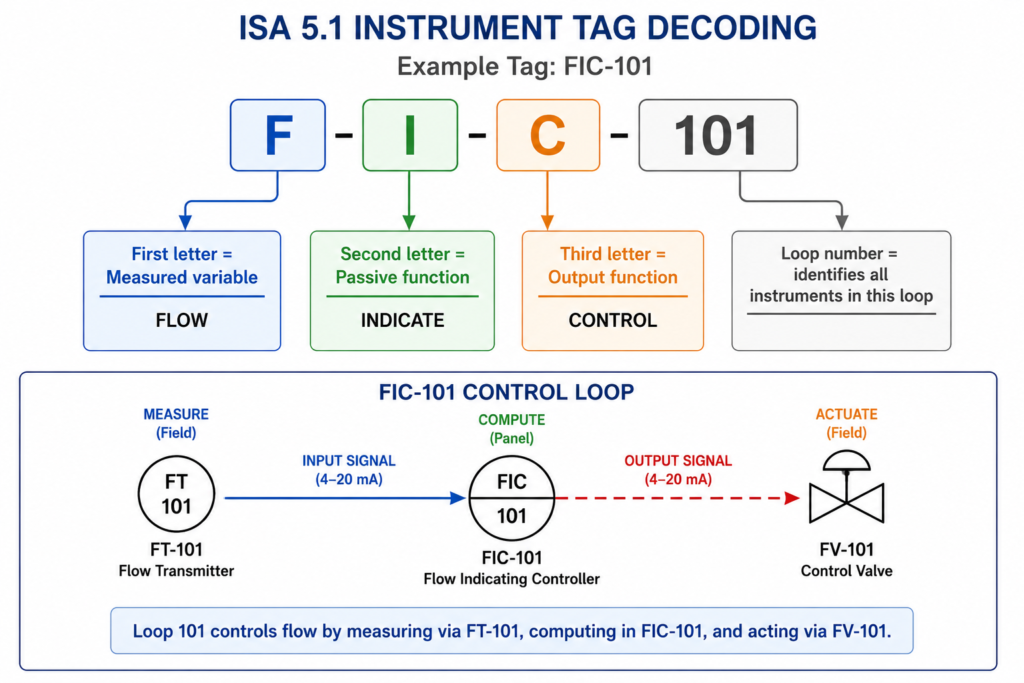
    An ISA 5.1 tag has two parts: letters and a number. The letters identify the function. The number identifies the loop.

    The letters consist of:

    1. First letter: the measured or initiating variable. What is being measured. F for Flow. T for Temperature. P for Pressure. L for Level.
    2. Second letter (modifier or function): adds detail to the first. D means differential. H means high. L means low. I means indicate.
    3. Third and subsequent letters: the output function. C means control (has a control output). T means transmit (sends a signal). S means switch (has a discrete on/off output). R means record.

    The number identifies the control loop. All instruments sharing the same number belong to the same control loop. FT-101, FIC-101, and FV-101 are all part of loop 101, the flow control loop.

    LetterMeasured variable (first letter)Modifier (second letter)Output function (third+ letter)
    AAnalysisAlarmAlarm
    CConductivityControlController
    DDensity / specific gravityDifferential
    EVoltageSensor / element
    FFlow rateRatio
    HHand (manual)High
    ICurrent (electrical)IndicateIndicator
    JPowerScan / multipoint
    KTime / scheduleControl station
    LLevelLowLight
    PPressure / vacuumPoint (test)
    QQuantityIntegrate / totalize
    RRadiationRecordRecorder
    SSpeed / frequencySafetySwitch
    TTemperatureTransmitter
    VVibrationValveValve (control element)
    WWeight / forceWell
    XUnclassifiedX-axisUnclassified
    YEvent / stateY-axisRelay / compute / convert
    ZPosition / dimensionZ-axisDriver / actuator

    Tag Examples You Will Encounter on Real P&IDs

    Tag exampleMeaningFull expansionBubble type
    FIC-101Flow Indicating ControllerFlow (F) + Indicate (I) + Control (C) + Loop 101Circle (field)
    PT-202Pressure TransmitterPressure (P) + Transmit (T) + Loop 202Circle (field)
    TIC-305Temp Indicating ControllerTemperature (T) + Indicate (I) + Control (C) + Loop 305Circle-line (panel)
    LT-401Level TransmitterLevel (L) + Transmit (T) + Loop 401Circle (field)
    PSV-501Pressure Safety ValvePressure (P) + Safety (S) + Valve (V) + Loop 501Hexagon (SIS)
    FE-102Flow ElementFlow (F) + Sensor/Element (E) + Loop 102Circle (field)
    LSH-403Level Switch HighLevel (L) + Switch (S) + High (H) + Loop 403Circle (field)
    AIT-601Analyser Indicating TransmitterAnalysis (A) + Indicate (I) + Transmit (T) + Loop 601Circle (field)
    The fastest way to read a tag you do not recognise:  Split the letters into groups. The first letter always gives the measured variable. Everything after it tells you what the instrument does with that measurement. FT: measures Flow, Transmits the signal. TIC: measures Temperature, Indicates it on a display, Controls a valve. PSV: Pressure Safety Valve. Once you know the first-letter meanings, the rest follows logically.

    Instrument Bubble Shapes: What the Circle Shape Tells You

    The tag letters and number sit inside a shape on the P&ID. That shape is called the instrument bubble, and it carries critical information about where the instrument is physically located and what type of system it connects to. An operator or maintenance technician reading a P&ID needs to know not just what an instrument measures, but where to find it in the field or in the control system.

    Symbol shapeWhat it meansLocationStandard
    Plain circleDiscrete instrument, field-mountedProcess line or equipmentISA 5.1 / ISO 10628
    Circle with lineInstrument mounted in panel or cabinetControl room panelISA 5.1
    Circle with double lineInstrument behind panel or in cabinetNot directly accessibleISA 5.1
    Circle with dashed lineShared display or shared controllerDCS or PLC shared systemISA 5.1
    HexagonComputer / programmable logic functionDCS, PLC, SIS logicISA 5.1
    Square / rectangleProgrammable controller or computerDCS or SCADA systemISA 5.1 / ISO variant
    DiamondDefined in process data or simulationProcess simulation toolCompany-specific

    The distinction between field-mounted and panel-mounted instruments matters operationally. A field transmitter is accessible at the process, where you can see the physical measurement point and the local indicator. A panel-mounted controller is in the control room. When you are planning field work around an instrument, knowing its location type from the bubble shape alone saves a trip to the control room to ask.

    P&ID Line Types: Reading the Connections Between Instruments

    The lines on a P&ID drawing are not all the same. Different line styles carry different types of signals between different types of elements. Misreading a line type means misunderstanding how an instrument connects to the process or to the control system, which in an operational context leads to wrong decisions about instrument behaviour and loop performance.

    Line typeWhat it representsWhen you see it
    Thick solid lineMain process pipe carrying the primary fluidThe backbone of any P&ID, carrying process fluid between equipment
    Thin solid lineInstrument signal line (pneumatic or electrical)Connecting a transmitter to a controller or indicator
    Dashed lineElectrical signal (wiring between instruments)Between field transmitter and DCS input card
    Dashed and dotted lineSoftware or data link (Fieldbus, HART, etc.)Digital communication between field device and control system
    Dotted lineHydraulic signalHydraulic control line on valve actuator
    Double lineJacketed pipe (pipe within a pipe for temperature)Heat-traced or cryogenic service piping
    Line with diagonal crossCapillary tube (filled system)Thermowell to filled temperature transmitter
    Thick dashed lineMechanical link between instrumentsConnecting two valves that move together
    Boundary box (dashed rect)Battery limit or system boundaryShows where one P&ID sheet hands off to the next

    Line Numbers: The Data Encoded in Every Pipe Label

    Every process pipe on a P&ID carries a line number, typically formatted as: nominal bore / service code / sequential number / pipe specification / insulation or tracing code.

    A line number such as 6-P-1001-CS150-I would decode as:

    • 6: 6-inch nominal bore pipe
    • P: service code for process fluid (company-specific codes vary)
    • 1001: sequential line number within the system
    • CS150: pipe specification: carbon steel, Class 150 ANSI flange rating
    • I: insulation required

    The pipe specification code connects to the piping materials class document, which defines the wall thickness, fitting standards, weld types, gasket materials, and testing requirements for every pipe of that specification class. Without the pipe spec, a piping team cannot make purchasing decisions or specify welds. The P&ID line number is the link that connects the drawing to the piping materials specification system.

    One control loop. Three instruments. One tag number connecting them all.

    Control Loops on a P&ID: Tracing Measurement to Action

    A control loop is the complete set of instruments and connections that measure a process variable, compare it to a target, and adjust something in the process to keep the variable at that target. Understanding how to trace a control loop on a P&ID is one of the most valuable skills for anyone working in process operations, instrumentation, or process engineering.

    The Three Components of Every Basic Control Loop

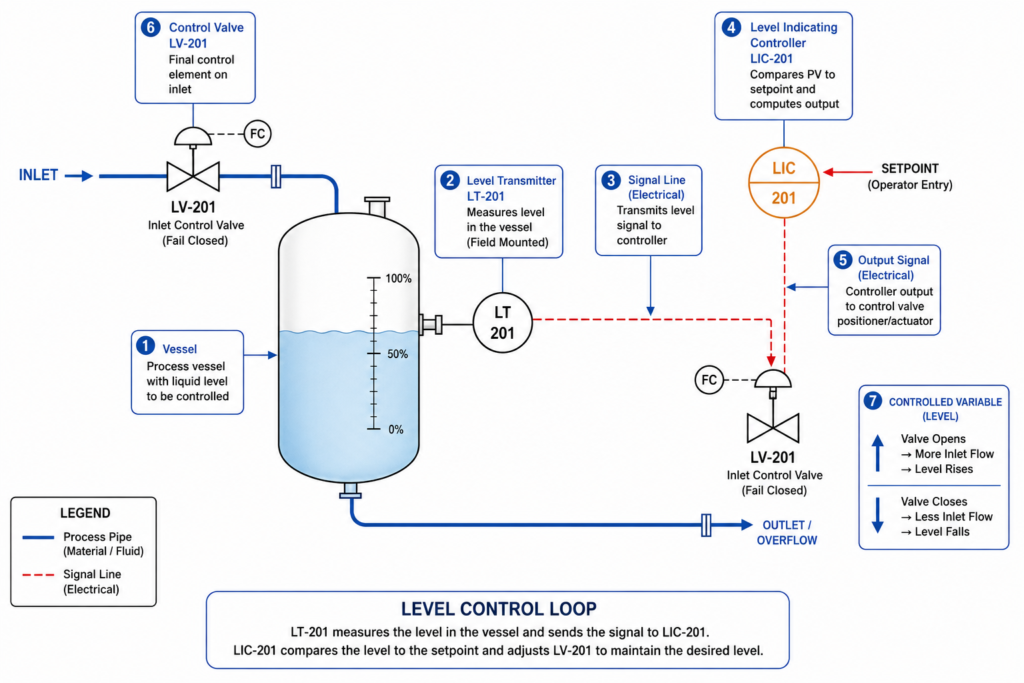
    • The measuring element: a sensor or transmitter that reads the process variable. Level transmitter LT-201. Pressure transmitter PT-301. Flow element FE-101. This connects physically to the process pipe or vessel.
    • The controller: receives the measurement signal, compares it to the setpoint, and calculates the required output to correct any deviation. LIC-201. FIC-101. These are shown with panel-mounted bubble symbols in most P&IDs, indicating they live in the DCS or control system.
    • The final control element: acts on the process. Almost always a control valve (LV-201, FV-101). Occasionally a variable-speed pump drive or an electrical heater. The actuating signal from the controller drives the valve position.

    The loop number connects all three. If you see LT-201, LIC-201, and LV-201 on the same P&ID, they are all part of loop 201. Trace the signal lines between them and you have the complete picture of how that measurement drives that valve.

    Cascade Control Loops

    Some P&IDs show cascade control: one controller’s output becomes the setpoint of a second controller. A temperature controller TIC-401 sets the setpoint of a flow controller FIC-402, which controls a steam valve FV-402. This is shown on the P&ID by the signal line from TIC-401 feeding into the setpoint input of FIC-402, rather than directly to a valve. Cascade loops appear more complex but follow the same tracing logic: follow the signal lines.

    Interlocks and Safety Instrumented Functions on P&IDs

    Not all control actions are continuous. Some are discrete: if a pressure reaches a certain level, shut a valve. If a level drops too low, trip a pump. These are interlocks and safety instrumented functions, and they appear on P&IDs with specific notation.

    Safety instrumented functions (SIFs) are shown with hexagon bubbles in ISA 5.1 notation, indicating they are handled by a Safety Instrumented System (SIS) rather than the regular DCS. A pressure switch PSH-501 triggering an emergency shutdown valve ESDV-501 on high pressure is a typical SIF. The hex bubble on PSH-501 and the notation on ESDV-501 linking it to the SIS logic identify this immediately to anyone reading the P&ID.

    Critical safety reading point:  Never plan a maintenance or operational change without first checking whether the instruments or valves involved are part of a Safety Instrumented Function. An SIF has a specific bypass and override procedure defined in the SIS documentation. Bypassing an SIF valve using normal maintenance isolation procedures can inadvertently disable a safety layer that prevents a serious incident. The P&ID is the first place to identify SIF involvement. The hex bubble and SIS loop numbers are the flags to look for.

    Process Equipment Symbols on P&IDs

    Process equipment on a P&ID is represented by standardised geometric symbols that indicate the type of equipment without showing its actual physical form. The symbols under ISO 10628 and ISA 5.1 differ in some cases, which is why the legend sheet matters. Here are the most common equipment types and their symbol conventions.

    Equipment typeISA symbolISO 10628 symbolNotes
    Centrifugal pumpCircle with arrowCircle with filled triangleArrow shows rotation direction
    Positive displ. pumpCircle with vertical lineRectangle with PD notationDistinguish from centrifugal
    CompressorTriangle pointing flow directionCircle with internal linesType noted in tag
    Heat exchangerInterlocked circlesRectangle with crossing linesDuty noted in line list
    Vessel / tankRectangle or cylinderRectangle or cylinderInternals shown if relevant
    Column / towerTall rectangle with traysTall rectangle with traysTray numbers sometimes shown
    ReactorRectangle with internal detailSimilar, R-type notationReaction type noted
    Filter / strainerDistinct shape with mesh linesSimilarRating and connection shown
    Fired heaterRectangle with flame symbolSimilarBurner arrangement may show
    Cooling towerTrapezoid with wavy lineSimilarCell count and type vary

    Valve Symbols on P&IDs: How to Tell Every Type Apart

    Valves are the most numerous symbols on any P&ID. A single process unit may contain hundreds of valves of different types, each shown with a specific symbol that identifies its physical operating principle. Getting these right is important for maintenance planning, isolation procedures, and procurement.

    Valve typeISA/ISO symbolTypical applicationActuator options
    Gate valveTwo triangles pointing inwardIsolation; fully open or closed onlyManual handwheel
    Globe valveCircle between two converging linesFlow throttling and controlManual, motor, pneumatic
    Ball valveCircle with a bar through itFast isolation, quarter-turnManual, pneumatic, electric
    Butterfly valveCircle with a diagonal barLarge bore isolation and controlManual, pneumatic, electric
    Check valveTriangle against a stop linePrevents reverse flowNone (self-actuating)
    Relief / safety valveArrow with spring symbolOverpressure protectionSelf-actuating (spring-set)
    Control valveBowtie (ISA) or rectangle (ISO/DIN)Automated flow, pressure, level controlPneumatic, electric, hydraulic
    Needle valveTwo triangles with fine openingFine flow adjustment, sample pointsManual
    Diaphragm valveCurved body symbolHygienic and corrosive serviceManual, pneumatic
    Plug valveDiamond or rectangle bodyMulti-port flow diversionManual, gear, actuated

    The Control Valve Symbol and Fail Position

    The control valve deserves specific attention because it carries more information than any other valve symbol. In ISA 5.1, a control valve body is a bowtie shape. In ISO 10628 and DIN standards, it is a rectangle. The actuator symbol sits on top of the valve body and indicates the actuator type.

    Below or adjacent to the control valve symbol, you will see the fail position annotation: FC (fail closed), FO (fail open), or FL (fail last). This annotation defines what happens to the valve if it loses its control signal, whether that is instrument air on a pneumatic actuator or electrical supply on an electric actuator.

    FC valves on process streams typically indicate that the closed position is the safer state for that valve if control is lost. FO valves indicate that open is safer. The process hazard analysis drives these decisions, and the P&ID makes the result visible to everyone who reads the drawing.

    The ISA vs ISO vs DIN Symbol Difference

    This is one of the most practically important points for anyone who works across international projects. The same control valve is drawn three different ways depending on which standard the drawing follows. In ISA 5.1 (North America and parts of Asia), a globe valve looks like a bowtie. In ISO 10628 (international, European), the valve body is a rectangle. In DIN 19227 (historically German, still common in European industrial plants), the symbol is similar to ISO but with stricter actuator notation conventions.

    The consequence: a process engineer moving from a North American project to a European plant will initially misread valve types because the symbols for the same valves look different. The solution is always the same: read the legend sheet first. Every P&ID drawing set should have a legend that defines every symbol used, including which standard was applied. Do not assume ISA or ISO without checking the title block.

    How to Read a P&ID: A Practical Step-by-Step Approach

    Reading a P&ID for the first time is overwhelming. A complex process unit P&ID can contain hundreds of symbols on a single sheet. The approach below makes it manageable.

    1. Start with the title block and legend. Confirm which drawing standard is applied, which revision you are reading, and what any custom symbols mean. Never skip this step on an unfamiliar drawing set.
    2. Identify the battery limits. The dashed boundary boxes at the edges of the drawing show where this P&ID connects to the adjacent drawings. Note the connecting line numbers and the sheet references so you can trace flows that cross sheet boundaries.
    3. Find the main process flow direction. Thick process pipe lines define the primary flow path. Follow the main stream from left to right as a starting orientation. Identify where material enters the drawing and where it exits.
    4. Identify major equipment. Vessels, pumps, compressors, and heat exchangers are the anchor points. Understand what each piece of equipment does in the process before looking at the instrumentation.
    5. Trace the pipe line numbers. Read the line number on each pipe. Size, service, spec, and insulation are all encoded. Cross-reference the spec with the piping materials class document if the material selection matters for your task.
    6. Read the valve types and tags. Identify isolation valves (gate, ball, butterfly) and control valves. Check fail positions on actuated valves. Note block valve arrangements around control valves, which tell you how to isolate the control valve for maintenance.
    7. Trace the control loops. Starting from any transmitter, follow the signal line to the controller, then from the controller to the control valve. All three will share a loop number. This is the complete picture of one control function.
    8. Identify safety devices. Look for PSVs (pressure safety valves), bursting discs, and hexagon-bubble SIS instruments. These define the overpressure protection and safety shutdown envelope for the equipment.
    9. Check utility connections. Identify where steam, cooling water, instrument air, and nitrogen connect to equipment. These are often shown as smaller diameter branch lines off utility headers.
    10. Cross-reference with the line designation table. The line designation table (also called the line list) holds the full specification for every line number on the P&ID. If you need to know the design pressure, operating temperature, or corrosion allowance for a line, the P&ID line number is the key to finding it in the line list.
    The most useful habit for P&ID reading:  When tracing a control loop, put your finger on the transmitter bubble and trace the signal line with your finger all the way to the controller, then to the control valve. Do not let your eye jump ahead. Follow the physical line path on the paper or screen. On complex P&IDs with many overlapping signal lines, it is easy to miss a junction or follow the wrong line branch. Physical tracing prevents the most common reading errors.

    P&ID Software in 2026: From CAD to Intelligent Engineering Databases

    The P&ID software market in 2026 splits clearly into two categories: drawing tools that produce P&ID-looking documents, and intelligent engineering databases that happen to display as P&IDs. The distinction matters significantly for how the drawings are maintained and how useful they are beyond the initial design phase.

    SoftwareDeveloperKey strengthBest for2026 status
    AVEVA P&IDAVEVAIntelligent P&ID, database-drivenOil and gas, petrochemicalIndustry standard, cloud roadmap
    SmartPlant P&IDHexagon PPMEPC project database integrationLarge capital projectsRebranding as Hexagon SDx
    AutoCAD P&IDAutodeskDWG-based, familiar interfaceSmaller projects, retrofitsSubscription, part of AEC suite
    CADWorx P&IDHexagon/IntergraphCAD-integrated intelligenceMid-size process plantsStrong US market presence
    Bentley OpenPlantBentley3D-linked, ISO 15926 dataOwner-operators, lifecycleStrong in energy sector
    E3.series ProcessZukenElectrical + process integrationMultidiscipline panel integrationEuropean market focus
    Lucidchart / VisioVariousSimple, fast markup toolConcept and review onlyNot intelligent, no database
    COMOSSiemensMultidiscipline lifecycle toolChemical, pharmaceutical plantsStrong digital twin integration

    Intelligent P&IDs vs Drawing-Based P&IDs

    A drawing-based P&ID, produced in AutoCAD P&ID or a generic diagramming tool, is essentially a sophisticated drawing. The symbols and line numbers look correct. But the drawing has no database behind it. If you want to extract a valve list from it, someone reads the drawing and types a spreadsheet. If you want to find all instruments in loop 101, someone searches the drawing manually.

    An intelligent P&ID, produced in AVEVA P&ID, SmartPlant P&ID, or COMOS, is a graphical interface to a database. Every symbol represents a real object in the engineering database. Every tag number is a record with attributes: service, size, material, design pressure, operating conditions, test requirements, spare parts reference. Extract a valve list and the software queries the database directly. Search for loop 101 and every instrument tagged 101 is highlighted automatically.

    For large capital projects and operating plants with hundreds of P&ID sheets and thousands of instruments, the difference between these two approaches is the difference between engineering information that supports operations and maintenance and engineering information that becomes progressively less useful as the plant ages and changes are made without updating every affected drawing.

    Digital P&IDs and AI in Process Engineering: What Is Changing in 2026

    The convergence of intelligent P&ID platforms with digital twin technology and AI processing is one of the more significant developments in process plant engineering in 2026. The P&ID has always been the most information-dense drawing in a process plant. The current trend is making that information actively machine-readable rather than just human-readable.

    AI-Assisted P&ID Digitisation

    Enormous amounts of process plant documentation exist as scanned paper P&IDs or flat PDF files with no database behind them. AI symbol recognition systems, now commercially available in 2026, can scan these legacy P&IDs, recognise instrument bubbles, valve symbols, equipment shapes, and line connections, and export the results to structured engineering databases at a fraction of the time and cost of manual transcription.

    Published research demonstrates automated recognition of P&ID symbols and connection topology at accuracy rates sufficient for engineering validation workflows. The practical use case: a plant built in the 1990s with paper P&IDs can now be digitised into an intelligent P&ID platform in weeks rather than years, giving operators and maintenance teams searchable, linkable drawing data for the first time in the plant’s operational history.

    P&IDs Connected to Digital Twins

    The ultimate destination for intelligent P&ID data is integration with the plant digital twin: a computational model of the plant that receives live sensor data and can simulate process behaviour, predict maintenance needs, and support engineering change management. The P&ID is the structural map that tells the digital twin what is connected to what. Without accurate P&ID data, the digital twin does not know the topology of the process.

    CMMS integration, where digital P&ID systems link directly to Computerised Maintenance Management Systems, is already standard in well-managed operating facilities. Clicking on a pump tag on a digital P&ID opens the maintenance history, spare parts record, and calibration schedule for that instrument directly in the CMMS. This connection is what makes a P&ID a living operational tool rather than a reference document that sits in a filing cabinet.

    Using AI for P&ID Documentation

    For process engineers and plant documentation teams, AI tools like Claude are being used to accelerate the documentation that accompanies P&ID development: writing process descriptions that explain what each P&ID sheet represents, generating hazard identification checklists from P&ID content, structuring operation procedures that reference specific P&ID elements, and producing training materials that explain control loops and safety functions to operations teams.

    The P&ID provides the technical content and structure. AI handles the communication layer: turning that technical content into readable, consistent documentation that supports operator training, management of change procedures, and regulatory submissions.

    How Operations and Maintenance Teams Use P&IDs Every Day

    Understanding the operational use of P&IDs places the reading skills from the previous sections in their most practical context.

    Isolation Planning and Lockout / Tagout

    Before any maintenance work on process equipment, the isolation scope must be defined: which valves are closed, which are locked, which instruments are isolated or bypassed. The P&ID is the tool used to identify every isolation point because it shows every valve in the system and its relationship to the equipment being maintained.

    A maintenance engineer planning an isolation for a centrifugal pump uses the P&ID to trace the suction and discharge piping, identify the nearest isolation valves, check for any bypass lines that must also be isolated, locate the drain points for de-pressurisation, and identify any instruments connected to the pump system that must be isolated or drained before maintenance begins. All of this information is on the P&ID. Without an accurate, up-to-date P&ID, isolation planning is guesswork.

    Fault-Finding and Process Troubleshooting

    When a process problem occurs, operators and process engineers use the P&ID to trace the cause. An unexplained flow reduction is traced from the flow transmitter back through the control loop to the control valve, then to the upstream isolation valves, checking whether any component in the loop could explain the observed behaviour. A pressure excursion is traced through the P&ID to identify which protection devices should have activated and which points are connected to the affected system.

    This troubleshooting use is why the accuracy of the P&ID is a safety issue, not just a documentation quality issue. A P&ID that does not reflect as-built plant configuration, one where a valve was added or removed without a drawing update, directs operators to non-existent isolation points or fails to show an additional line that provides an unexpected flow path. Outdated P&IDs have been contributing factors in process safety incidents.

    10 P&ID Reading Mistakes That Lead to Wrong Decisions

    These are the errors that show up most consistently when engineers and operators unfamiliar with P&ID reading attempt to use the drawings for operational or maintenance decision-making. Each one has a direct operational consequence.

    MistakeWhy it mattersHow to prevent it
    Using outdated P&ID revisionYou plan maintenance based on wrong valve locationsAlways verify drawing revision against the facility document register before any field work.
    Ignoring the legend sheetCompany-specific symbols misread as standard onesRead the legend and symbol key first on any unfamiliar drawing set. Never assume standard symbols.
    Confusing ISA and ISO symbol setsGlobe valve looks like a different valve typeCheck the title block for the standard applied. ISA and ISO have significant symbol differences.
    Treating P&ID as a piping layoutWrong expectations about physical pipe routingP&IDs are schematic, not spatial. Use isometric drawings for actual routing and dimensions.
    Not reading control loop numbersInstruments in the same loop not identifiedThe loop number after the letters connects all related instruments. Always trace the full loop.
    Ignoring fail position on valvesValve behaviour during shutdown misunderstoodFC (fail closed), FO (fail open), FL (fail last) on actuated valves defines safety behaviour.
    Not checking battery limit tie-insSystem scope undefined, cross-boundary work missedBattery limit boxes define where P&ID sheets connect. Always trace to the adjacent sheet.
    Missing safety instrumented functionsSIF trips and interlock logic not identifiedHexagon symbols and SIS loop numbers flag safety functions. These have priority over all other operations.
    Reading from left to right onlyControl loops missed because instruments branch upP&IDs are not linear. Follow signal lines in all directions from each instrument bubble.
    Assuming unlabelled valves are minorUnlabelled isolation valves can affect LO/TO scopeEvery valve on a P&ID is intentional. If it has no tag, it still affects isolation and maintenance planning.

    Conclusion:

    Everything in a process plant starts and ends with the piping and instrumentation diagram. It is the drawing that design engineers use to specify every component. It is the document that operations teams use to understand what they are running. It is the reference that maintenance teams use to plan every isolation and every instrument calibration. And it is the record that regulatory bodies and insurance assessors use to verify that the plant is built and operated as designed.

    Reading a P&ID fluently takes practice, but the underlying system is logical. The ISA 5.1 tag structure encodes the function of every instrument in a consistent, decodable format. The symbol library distinguishes every valve type and every equipment category. The line notation captures every pipe attribute in a compact reference. The control loop tracing connects measurement to control action in a traceable graphic.

    In 2026, P&IDs are becoming more powerful through digitisation: searchable engineering databases, AI-assisted legacy digitisation, digital twin integration, and CMMS linkage that makes the drawing actively useful during operations rather than only during design. The drawings are changing format and gaining machine-readability. The fundamental skill of reading them accurately has not changed and will not change.

    Read the legend. Trace the loops. Check the revision. Never assume.

    Frequently Asked Questions

    What is a P&ID drawing?

    A P&ID (Piping and Instrumentation Diagram) is an engineering drawing that shows every pipe, valve, instrument, and control element in a process system. It includes pipe sizes and material specifications, every valve by type and tag number, every instrument with its ISA tag, the control loops connecting instruments to controllers and final control elements, and all safety systems including pressure relief valves and emergency shutdowns. P&IDs are used throughout the life of a plant: during design, construction, operations, and maintenance. They are not spatial drawings. They show what components exist and how they are connected, not where they physically sit in the plant.

    How do you read an instrument tag on a P&ID?

    An instrument tag on a P&ID follows the ISA 5.1 standard format: letters followed by a loop number. The first letter indicates the measured variable (F for Flow, T for Temperature, P for Pressure, L for Level). Subsequent letters indicate the function (I for Indicate, C for Control, T for Transmit, S for Switch). The number identifies the control loop. So FIC-101 means: Flow (F) + Indicating (I) + Controller (C) in loop 101. All instruments with the number 101 belong to the same control loop. The bubble shape around the tag indicates instrument location: a plain circle is field-mounted, a circle with a line is panel-mounted.

    What is the difference between a P&ID and a process flow diagram?

    A Process Flow Diagram (PFD) shows the high-level overview of a process: major equipment, main process streams, and key operating conditions. It contains limited valve detail and shows only key instruments. A P&ID shows every pipe with its size, material specification, and insulation requirement, every valve by type, every instrument with its tag and loop number, and all safety systems. A typical process unit might have 10 to 30 PFD sheets and 100 to 300 or more P&ID sheets for the same scope. PFDs are used for process understanding and early design. P&IDs are the primary reference for detailed engineering, construction, operations, and maintenance.

    What does fail closed (FC) and fail open (FO) mean on a P&ID valve?

    FC (fail closed) and FO (fail open) are fail-safe position designations on actuated control valves. FC means the valve moves to the fully closed position if it loses its actuating signal, whether that signal is air pressure, electrical power, or hydraulic supply. FO means it moves to the fully open position on signal loss. FL (fail last or fail locked) means the valve stays in its last position when signal is lost. These designations define the safe state of the process on instrument or utility failure and are critical information for process hazard analysis, shutdown planning, and operations procedures. Always check the fail position before operating or isolating an actuated valve.

    What is a control loop on a P&ID?

    A control loop on a P&ID is the complete set of instruments and connections that measure a process variable, compare it to a setpoint, and adjust a final control element to bring the variable to target. A basic loop contains three elements: a transmitter that measures the variable (such as a flow transmitter FT-101), a controller that calculates the required output (FIC-101), and a final control element that acts on the process (a control valve FV-101). All three share the loop number 101. Signal lines on the P&ID connect these elements to show the measurement path from the process to the transmitter, the signal path to the controller, and the output path to the control valve.

    Are P&IDs the same as piping drawings?

    No. P&IDs and piping drawings serve completely different purposes. A P&ID is a schematic diagram showing what components exist and how they connect functionally. It has no scale, no spatial accuracy, and does not show the physical routing of pipes through the plant. Piping drawings, including isometric drawings and piping general arrangement drawings, show the actual three-dimensional routing, dimensions, support locations, and physical configuration of the pipework. An engineer needs both: the P&ID to understand what is connected and why, and the piping drawing to understand where it physically goes and how to access it in the field.


    ISA (International Society of Automation) — ANSI/ISA-5.1-2024 Standard Overview ()

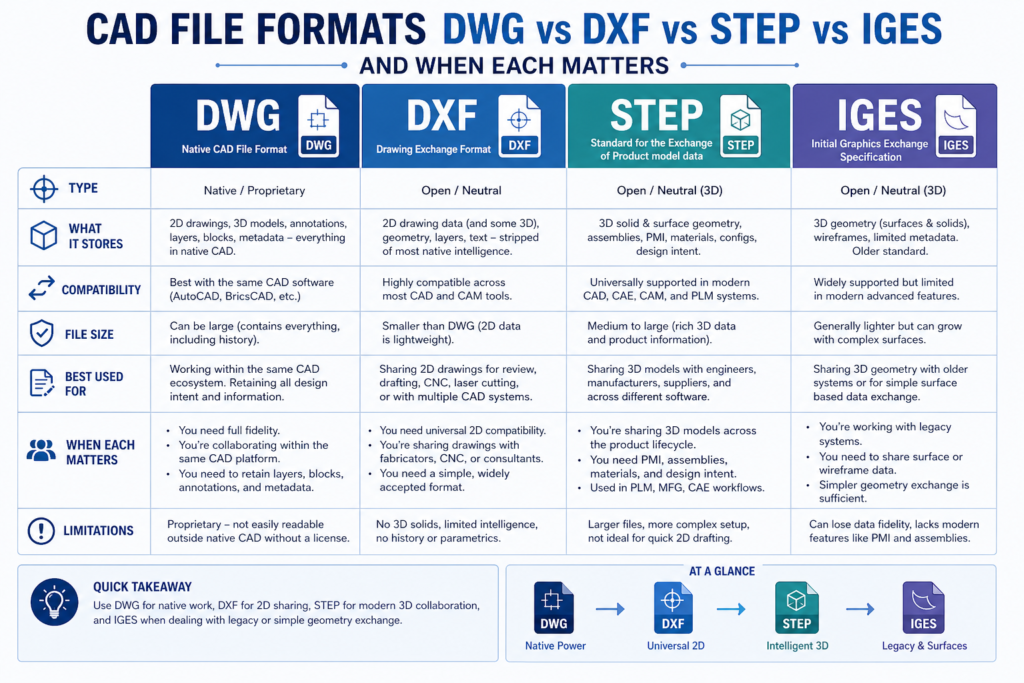
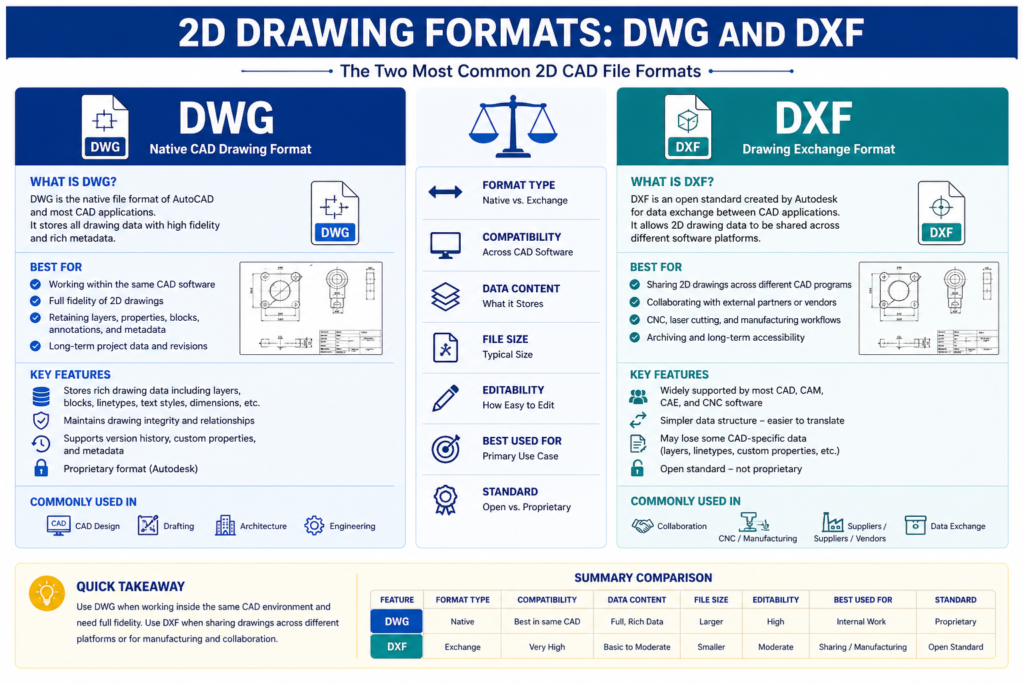
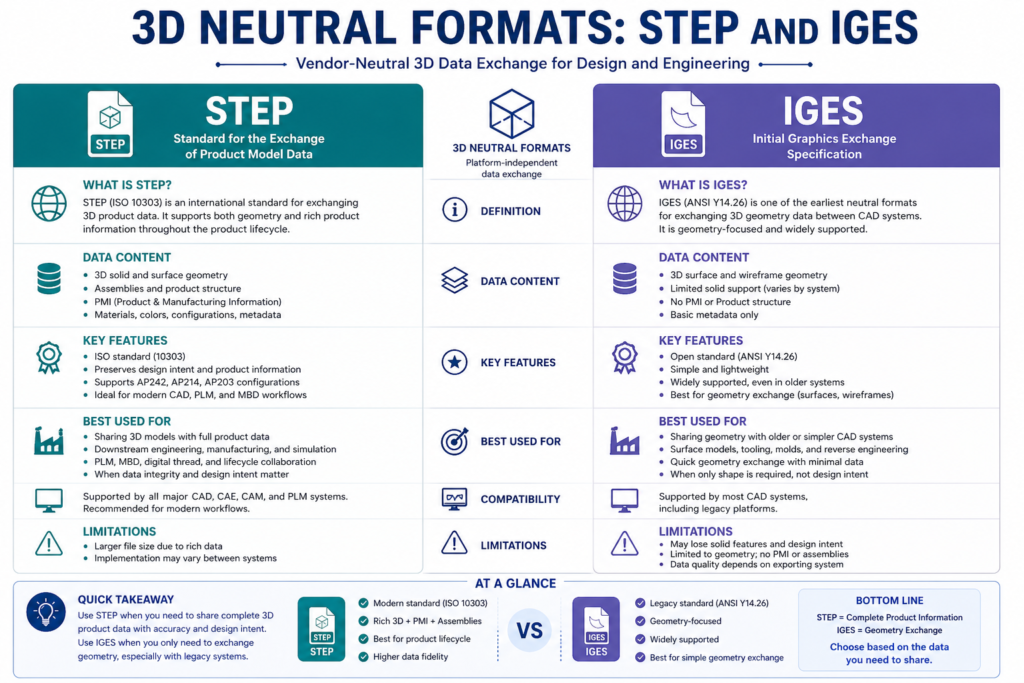
  • CAD File Formats Explained: DWG vs DXF vs STEP vs IGES and When Each Matters

    CAD File Formats Explained: DWG vs DXF vs STEP vs IGES and When Each Matters

    A supplier sends back a file you cannot open. A manufacturer returns a model with geometry errors that were not in your original design. A client cannot view the drawing you emailed them. In each of these cases, there is a good chance the format was wrong, not the content. CAD file formats are one of the most misunderstood and most consequential decisions in any engineering workflow, and getting them wrong costs time at every stage of a project.

    This guide explains the most common CAD file formats, what each one actually is, what it carries, what it cannot carry, and when to use or request it. Whether you are an engineer managing a design handover, a project manager coordinating with suppliers, or a buyer receiving deliverables from a CAD partner, understanding file formats means fewer errors, fewer delays, and fewer frustrating email chains about why a file will not open.

    Quick Reference: CAD File Formats at a Glance

    FormatTypeBest ForWorks WithAvoid When
    DWGNative / Proprietary2D drafting, AutoCAD workflows, drawing exchange between AutoCAD usersAutoCAD, BricsCAD, NavisworksSharing with non-Autodesk tools, compatibility issues are common
    DXFOpen Exchange2D drawing exchange across different CAD platforms and older softwareAlmost any CAD or CNC toolTransferring 3D geometry, DXF 3D support is inconsistent
    STEPOpen Neutral3D model exchange between different CAD systems, supplier collaborationSolidWorks, CATIA, NX, Creo, Fusion 360When you need full parametric feature tree, STEP is non-parametric
    IGESOpen Neutral (legacy)Surface geometry transfer, legacy systems, aerospace/defence workflowsMost major CAD platformsNew projects, STEP is the modern replacement in most cases
    STLMesh / Output3D printing, additive manufacturing, rapid prototypingAll 3D printers and slicing softwarePrecision engineering or machining, no dimensions, no tolerances
    PDFVisual ReferenceClient approvals, drawing review, non-editable distributionAny PDF viewerActive design collaboration, cannot be edited back to CAD
    CAD File Formats DWG, DXF, STEP, IGES, STL, PDF

    Why CAD File Formats Matters More Than Most People Realise

    A CAD file is not just a container for geometry. Depending on the format, it may carry, or fail to carry, parametric feature history, assembly structure, tolerances and GD&T callouts, material properties, layer information, and metadata. When a file is converted from one format to another, some of that information is always lost. The question is which information, and whether that loss matters for the next stage of the workflow.

    This is why format is a workflow decision, not just a technical preference. The right format depends on who receives the file, what they intend to do with it, and what tools they are using. A STEP file that works perfectly for a supplier machining your part tells you nothing about whether it is the right format for a client doing a design review, a 3D printing bureau producing a prototype, or a structural analyst running an FEA simulation.

    There is no single best CAD file formats. There is only the right format for the specific recipient, tool, and purpose. The most common and costly mistake in CAD file exchange is sending whatever format is convenient rather than what the downstream workflow actually requires.

    2D Drawing Formats: DWG and DXF

    DWG and DXF are the two dominant formats for 2D engineering drawings. They share a common origin, both were created by Autodesk for AutoCAD, but they serve different purposes and have meaningfully different compatibility profiles.

    DWG (.dwg) is AutoCAD’s native binary file format. It is the working format for AutoCAD and the broader Autodesk ecosystem, including Inventor, Civil 3D, and Revit in some workflows. DWG files are compact and preserve all AutoCAD-specific features: layers, blocks, line types, dimension styles, layouts, and drawing scale settings. The limitation is compatibility: while many CAD tools claim to support DWG, the format is proprietary and Autodesk updates its specification with each AutoCAD release. Files created in a newer version of AutoCAD may not open correctly, or at all, in older versions or non-Autodesk tools.

    DXF (.dxf), Drawing Exchange Format, was also created by Autodesk but as an open format, specifically to allow other CAD tools to read AutoCAD geometry. Because DXF is ASCII-based (in its standard form), it is readable by an enormous range of software including most CNC controllers, laser cutters, plasma cutters, and virtually every CAD platform on the market. It is the most universally compatible 2D format in engineering.

    2D Drawing Formats DWG and DXF CAD file formats

    DWG vs DXF: Side-by-Side Comparison

    PropertyDWGDXF
    Format typeProprietary binary format owned by AutodeskOpen ASCII or binary exchange format
    Primary useNative working format for AutoCAD and Autodesk toolsCross-platform 2D drawing exchange
    CompatibilityBest with AutoCAD family; variable with other toolsNear-universal, works with almost any CAD or CNC software
    3D supportYes, solid and surface geometryLimited, 3D data transfer is inconsistent
    File sizeCompact binary formatLarger (ASCII version); binary DXF is more compact
    Parametric dataNoNo
    When to request itYour supplier or client uses AutoCAD as their primary toolYou need to share drawings with a different CAD platform or CNC machine

    For practical purposes: if both parties are using Autodesk tools, share DWG. If the recipient uses a different CAD platform, a CNC machine, or any tool outside the Autodesk ecosystem, DXF is the safer and more reliable choice. When in doubt, send both.

    3D Neutral Formats: STEP and IGES

    When you need to transfer a 3D model, a solid body, a surface model, or an assembly, between different CAD systems, you need a neutral format. Native CAD files (SolidWorks .sldprt, CATIA .CATPart, NX .prt, Creo .prt) are proprietary and require the originating software to open. STEP and IGES are the two dominant neutral formats that work across the industry.

    STEP (.stp or .step), Standard for the Exchange of Product model data, is the current international standard, governed by ISO 10303. It is the most widely used neutral format for 3D model exchange in manufacturing today. STEP carries solid geometry, surface geometry, and assembly structure accurately across different CAD environments. A STEP file generated in SolidWorks will open cleanly in CATIA, NX, Creo, Fusion 360, FreeCAD, or any other modern CAD platform. This is as close to a universal 3D format as the engineering industry has.

    IGES (.igs or .iges), Initial Graphics Exchange Specification, is STEP’s predecessor. Developed in the 1980s under ANSI, IGES was the dominant neutral format for decades and remains in active use in aerospace, defence, and some government procurement programmes that have not transitioned to STEP. IGES handles surface and wireframe geometry well but is less reliable for solid body transfer and often loses assembly structure on import.

    3D Neutral Formats STEP and IGES SImutecra

    STEP vs IGES: When to Use Each

    PropertySTEP (.stp / .step)IGES (.igs / .iges)
    StandardISO 10303, current international standardANSI Y14.26M, established 1980, still maintained
    Format typeNeutral open standardNeutral open standard (older)
    3D geometrySolid bodies, surfaces, assemblies, metadataSurfaces and wireframe geometry primarily
    Assembly supportYes, full assembly structure preservedLimited, assembly data often lost on import
    Parametric dataNo, geometry only, no feature historyNo, geometry only
    Industry adoptionCurrent standard, used across manufacturing globallyLegacy, still required in some aerospace and defence programmes
    Recommended forAll new 3D model exchange between different CAD systemsLegacy system compatibility or where STEP is explicitly not supported
    The most important limitation of both STEP and IGES is that neither carries parametric feature history. When a supplier or partner imports your STEP file, they receive geometry, not an editable feature tree. If future modification of the model is required, the native CAD file formats must be provided alongside the STEP. This is non-negotiable in any long-term design relationship.

    Other Formats You Will Encounter: STL, PDF, and Native Files

    Beyond the four main formats, three others appear regularly in engineering workflows and are worth understanding clearly.

    STL (.stl), stereolithography, is a mesh format that represents 3D geometry as a collection of triangular faces. It is the standard input format for 3D printers and additive manufacturing equipment. STL files carry no dimensional accuracy, no tolerances, no material data, and no parametric information, they are output files for fabrication, not engineering documents. Sending an STL to a CNC machine shop is not appropriate. Sending a STEP to a 3D printing bureau is also not appropriate unless they specifically ask for it. Each format belongs to its process.

    PDF (.pdf) is not a CAD format in the engineering sense, but it is the most widely used format for drawing distribution and approval. A 2D engineering drawing exported to PDF is universally readable, non-editable, and appropriate for client review, manufacturing reference, and project archiving. PDF should accompany every drawing deliverable, it is the human-readable record of what the CAD file formats contains. It is not a substitute for a proper CAD file formats in any active design workflow.

    Native CAD files (.sldprt, .CATPart, .prt, .ipt, etc.) are the working formats specific to each CAD platform. They contain the full parametric feature tree, design history, configurations, and all information that allows a model to be meaningfully edited. Native files should always be retained and should be requested as a deliverable alongside STEP and PDF in any outsourced CAD engagement. Receiving only a STEP from a CAD partner means any future modification requires rebuilding the model from scratch.

    Real-World Example: A Product Sent to Three Different Destinations

    A mechanical assembly is designed in SolidWorks, a housing, an internal shaft, four fasteners, and two seals. The design is complete and ready for fabrication and review. Three different destinations require the same data in three different formats.

    Destination 1: The Machine Shop
    The machinist needs to manufacture the housing and shaft. They use their own CAD tool to verify geometry and their CNC software to generate toolpaths. They request STEP for the 3D geometry and DXF for the 2D detail drawings. The STEP gives them an accurate solid body to check fit and clearances. The DXF feeds directly into their CNC controller. A PDF of the detail drawings is sent alongside as a manufacturing reference.
    Destination 2: The Client for Design Approval
    The client has no CAD software. They need to review the design, confirm dimensions, and sign off before manufacturing begins. A PDF of the general assembly drawing and a set of rendered views are sent. The client can mark up the PDF, review dimensions, and approve, without needing to install or understand any CAD tool.
    Destination 3: The 3D Printing Bureau for a Prototype
    Before committing to machined parts, a prototype of the housing is required. The 3D printing bureau requests an STL file. The SolidWorks model is exported to STL at high resolution. The bureau loads it into their slicing software, checks wall thickness and orientation, and prints. The STL carries no engineering dimensions, it is geometry only, which is all the printer needs.

    Three destinations, three CAD file formats, all from the same original SolidWorks model. The format decision was made based on the recipient’s tool and purpose, not based on what was easiest to export.

    Which CAD File Formats to Request From Your Engineering Partner

    One of the most practical questions in any outsourced CAD engagement is what file formats to specify in your brief. The answer depends on your downstream workflow. Use this as a reference when writing your CAD specification or RFQ:

    ScenarioRequest This FormatWhy
    Sending 2D drawings to a machine shopDXF or PDFDXF for CNC-ready files; PDF as a readable reference. Always send both if possible.
    Sharing a 3D model with a supplier using different CADSTEP (.step)STEP is the universal neutral format, almost every modern CAD tool imports it cleanly.
    Handing off a model for 3D printingSTL3D printers and slicing software require mesh format, not solid CAD file formats.
    Getting a design reviewed by a client or stakeholderPDFNon-editable, universally readable, no CAD software required on the client’s end.
    Collaborating with an Autodesk-based teamDWGNative format for the entire Autodesk ecosystem, no translation loss.
    Working with a legacy aerospace or defence supplierIGES or STEPCheck their specification, some legacy programmes still mandate IGES. Default to STEP otherwise.
    Receiving deliverables from your CAD partnerNative + STEP + PDFNative file for future editing; STEP for cross-platform use; PDF for approval and archiving.

    As a general rule: always request the native CAD file formats as a standard deliverable, regardless of what else you ask for. It is the only format that preserves full editability. The STEP and PDF are for distribution, the native file is for retention and future work.

    Frequently Asked Questions

    1. What is the difference between DWG and DXF?

    DWG is AutoCAD’s native binary format, compact, feature-rich, and best shared between Autodesk tools. DXF is an open exchange format originally created by Autodesk to allow other software to read AutoCAD files. DXF works across almost any CAD or CNC platform but has limited and inconsistent 3D support. For 2D drawing exchange outside the Autodesk ecosystem, DXF is the more reliable choice for CAD file formats.

    What is a STEP file and why is it the standard for 3D exchange?

    STEP (Standard for the Exchange of Product model data) is an ISO-standardised neutral file format that carries 3D solid geometry, surfaces, and assembly structure between different CAD systems without being tied to any single vendor. It is the current international default for 3D model exchange because it is widely supported, geometry-accurate, and preserves assembly relationships. Its main limitation is that it does not carry parametric feature history, the model arrives as geometry, not as an editable feature tree.

    Is IGES still used in engineering?

    Yes, but primarily in legacy and regulated environments. IGES (Initial Graphics Exchange Specification) predates STEP and was the dominant neutral format for decades. It is still required by some aerospace, defence, and government programmes that have not migrated to STEP. For new projects with no legacy system constraint, STEP is the better choice, it handles solid geometry and assemblies more reliably than IGES. CAD file formats

    Can I convert a STEP file back to native CAD with full parametric features?

    No. STEP files carry geometry, solid bodies and surfaces, but not parametric feature history. When a STEP file is imported into SolidWorks, CATIA, or any other parametric CAD tool, it arrives as a dumb solid: you can modify it by pushing and pulling faces, but you cannot access the original feature tree, sketches, or design intent. If you need a fully editable parametric model, you need the native CAD file formats from the originating software.

    What CAD file formats should I ask for from my engineering partner?

    For a complete and future-proof deliverable, request three formats: the native CAD file formats (in whatever software was used, SolidWorks .sldprt, CATIA .CATPart, etc.) for future editing; a STEP file for cross-platform 3D exchange; and a PDF of all 2D drawings for approval, archiving, and manufacturing reference. For 2D-only work, request DXF alongside the PDF as a CAD file formats.

    What is the difference between STL and STEP?

    STEP is an engineering format that represents precise solid geometry, it is accurate to the mathematical definition of the model and suitable for manufacturing. STL is a mesh format that approximates surfaces with triangles, it loses precision and carries no dimensional, tolerance, or material information. STL is used exclusively for 3D printing and additive manufacturing. Never send an STL to a machine shop expecting CNC-accurate results for CAD file formats.

    The Bottom Line

    CAD file formats are not a technical afterthought. They are a workflow decision that determines whether the right information reaches the right person in a form they can actually use. DWG and DXF carry 2D drawings. STEP carries 3D geometry between different CAD systems. IGES serves legacy and regulated environments. STL serves additive manufacturing. PDF serves human review and archiving. Native files serve future editability.

    The teams that get this right specify formats at the start of a project, in the brief, in the RFQ, in the supplier specification, not after a file arrives in a format no one can open. If you are outsourcing CAD work or receiving deliverables from an engineering partner, building a clear CAD file formats requirement into your specification is one of the simplest ways to prevent delays that have nothing to do with the quality of the design itself.

    Getting the Right Files the First Time
    At Simutecra CAD Drafting Services, every deliverable is packaged in the formats your team actually needs, native CAD files for editing, STEP for supplier exchange, and fully detailed PDFs for manufacturing reference and approval. We confirm file format requirements at the start of every project, not after the work is done.Tell us about your project and we will advise on the right format package for your workflow and manufacturing partners.
    Reach out to us today, Simutecra
  • The Most Common Types of Engineering Drawings (And What Each One Is Actually For)

    The Most Common Types of Engineering Drawings (And What Each One Is Actually For)

    If you’ve ever handed a design to a manufacturer and gotten back something completely wrong, there’s a good chance the issue wasn’t the design, it was the drawing. Understanding the different types of engineering drawings isn’t just technical trivia; it’s the difference between a project that flows and one that bleeds time and money on avoidable revisions.

    Engineering drawings are the universal language of making things. From a steel bracket for a conveyor system to an entire building’s HVAC layout, every physical product or structure gets communicated through drawings before it ever becomes real. But not all engineering drawings are the same, and using the wrong type, or misunderstanding what a drawing is supposed to communicate, is one of the most common and costly mistakes in product development and manufacturing.

    This guide covers the four most common drawing types, what each one does, who reads it, and where teams typically go wrong, followed by a quick-reference table and an FAQ optimised for the questions engineers and manufacturing managers are actually searching for.

    Quick Reference: Engineering Drawing Types at a Glance

    Drawing TypePrimary PurposeKey ContentWho Reads It
    Detail DrawingDefine how to manufacture a single partDimensions, tolerances, material, surface finish, GD&TMachinists, CNC operators, fabricators
    Assembly DrawingShow how parts fit and connectExploded or assembled view, BOM balloon callouts, clearancesTechnicians, assembly teams, QA inspectors
    Schematic / DiagramCommunicate system function and flowStandardised symbols, logic connections, not to scaleElectrical, instrumentation, process engineers
    Layout / GA DrawingDefine spatial arrangement within an envelopeOverall dims, equipment placement, clearances, interfacesAll disciplines, clients, contractors, planners
    most common types of engineering drawings

    An article from ScienceDIrect says: “The modern engineering drawing has become a very sophisticated method of relaying information about the geometry of parts and assemblies.”

    Detail Drawings, The Blueprint for a Single Part

    If you only know one type of engineering drawing, make it this one. A detail drawing, sometimes called a part drawing, is a fully dimensioned, annotated drawing of a single component. Its entire job is to give a manufacturer or machinist every piece of information they need to produce that one part exactly as designed. Nothing more, nothing less.

    A complete detail drawing includes orthographic views (front, top, side), all critical dimensions, tolerances, material specifications, surface finish requirements, and any relevant notes about manufacturing processes. In environments using GD&T (Geometric Dimensioning and Tolerancing), the detail drawing is also where those callouts live, defining not just size, but shape, orientation, and location of every controlled feature.

    A detail drawing is not a sketch. It is a legal-grade manufacturing document. Manufacturers produce exactly what the drawing says, not what you meant. Every ambiguity on a detail drawing is a defect waiting to happen on the shop floor.

    What it’s for: Manufacturing a single, discrete part. If someone at a machine shop is going to cut, mill, turn, or fabricate something from your design, they need a detail drawing.

    A detail drawing is also the document that gets revised when a part changes. Version control on detail drawings is not optional in a serious engineering environment, it is what keeps the machinist, the inspector, and the assembly technician all working from the same revision.

    Where teams go wrong: Over-constraining the drawing with redundant dimensions that create closed loops, making it mathematically impossible to satisfy all tolerances simultaneously. Equally common is leaving tolerances out entirely and assuming the shop will apply sensible defaults. Neither approach ends well.

    Assembly Drawings, Showing How the Parts Come Together

    Once you have individual parts designed, someone needs to understand how they fit together. That is the job of an assembly drawing. Rather than describing how to manufacture each component, an assembly drawing shows the spatial relationships between components, which part connects to which, in what orientation, and how the complete unit looks when assembled.

    Assembly drawings typically show the product in an assembled state, with callout numbers (called balloons) that correspond to a parts list or Bill of Materials (BOM). They do not include manufacturing dimensions, that information lives in the detail drawings. What they do include is clearances, mating features, fastener locations, and sometimes assembly sequence instructions.

    There are two common sub-types:

    General assembly (GA) drawings show the complete, final assembly at a high level, useful for understanding the overall product and communicating with clients, procurement teams, or project managers who need a picture of the whole before the parts.

    Sub-assembly drawings focus on a specific module or section of a larger product. A complex machine might have dozens of sub-assemblies, each with its own drawing, before they all come together in the general assembly. This keeps individual drawings readable and reduces the risk of assembly errors on the floor.

    Real-World Example: A Hydraulic Pump Unit
    Consider a small hydraulic pump unit being built for an industrial client. The pump housing, shaft, seals, and end plates each have their own detail drawing. The assembly drawing is what the technician in the assembly shop refers to during build, it shows which seal goes where, the correct bolt torque sequence, and how the shaft aligns to the motor. Without the assembly drawing, those individual detail drawings are a pile of disconnected information. With it, the build is repeatable by any trained technician, every time.

    What it’s for: Communicating assembly instructions to technicians, verifying that components fit together correctly before manufacturing begins, and supporting procurement by identifying all required parts in one document.

    Schematic and Diagram Drawings, Communicating Systems, Not Shapes

    Not every engineering drawing is about physical geometry. A significant category of drawings deals with systems, how energy, fluid, or signals flow through a design. These schematic and diagram drawings use standardised symbols rather than realistic shapes to communicate function. They answer ‘how does it work?’ rather than ‘how is it shaped?’

    The most common types in this category:

    Electrical schematics show how electrical components are connected, resistors, switches, relays, power sources, using standardised IEC or ANSI symbols. They do not show where components are physically located on a board; they show how they are logically connected. A schematic for a motor control panel maps every contact, coil, and protection device without any concern for physical layout.

    P&ID drawings (Piping and Instrumentation Diagrams) are the backbone of process engineering, oil and gas, chemical plants, water treatment facilities. A P&ID shows all piping, instrumentation, valves, and control elements in a process system, along with their interconnections. It is not drawn to scale, and it does not tell you where a pipe physically runs in a building, it tells you what connects to what and how the system is controlled.

    Wiring diagrams are a step closer to physical reality than schematics, they show actual wire routing between components and are commonly used by electricians and field technicians during installation. When a schematic answers ‘what is connected to what?’, a wiring diagram answers ‘which wire goes where?’

    A P&ID is not the same as a general arrangement drawing. A schematic is not a wiring diagram. In industries like oil and gas or industrial electrical, using the wrong drawing type to communicate system information creates real-world errors, and those errors can be costly or dangerous.

    What they’re for: Designing, troubleshooting, and communicating how a system functions. In maintenance and operations, technicians rely on schematic and diagram drawings daily to diagnose faults, plan modifications, and verify that systems are correctly configured.

    Layout and General Arrangement Drawings, The Big Picture

    Sometimes you need to step back from individual parts and systems and show the whole picture. Layout drawings, also called general arrangement or GA drawings in a spatial context, communicate how everything fits within a physical space or envelope. They are the coordination document: the drawing that aligns mechanical, structural, electrical, and civil disciplines before anyone starts building.

    These drawings are common in three broad contexts:

    Facility and plant design, where equipment placement, access paths, maintenance clearances, and structural interfaces all need to be coordinated across multiple engineering disciplines before any steel is ordered or any concrete is poured.

    Engineering Drafting - Simutecra

    Structural engineering, where a GA drawing might show beam placements, column grid lines, and connection locations across an entire building level, giving the structural team, the architect, and the MEP engineers a shared spatial baseline.

    Product packaging and enclosure design, where a layout drawing shows how components fit inside a chassis, panel, or housing, ensuring that every PCB, connector, cooling element, and cable run actually fits before detailed design work begins on each individual part.

    A layout drawing answers ‘where does everything go?’, not ‘how is each part made?’ These are different questions that require different documents. When layout drawings start accumulating manufacturing dimensions, they become ambiguous and difficult to maintain.

    What it’s for: Spatial coordination, client approval, interdisciplinary design review, and installation planning. In construction and large-scale engineering projects, the layout drawing is often the first drawing reviewed in any project meeting, because it gives everyone in the room a shared spatial understanding of what is being built.

    What to watch out for: Layout drawings can become a crutch. Some teams try to include too much detail in a layout drawing, blurring it with detail drawings or assembly drawings. Keep your drawing types disciplined. The moment a layout drawing tries to be everything, it becomes useful to no one.

    Putting It All Together, Which Drawing Do You Actually Need?

    Before a design goes into production, a complete drawing package typically includes all four types working together. A practical way to decide which drawings your project needs:

    QuestionIf YesDrawing Type Needed
    Will someone manufacture this part from scratch?YesDetail Drawing
    Does someone need to assemble multiple parts together?YesAssembly Drawing (GA or Sub-Assembly)
    Does the product involve electrical, fluid, or gas systems?YesSchematic / P&ID / Wiring Diagram
    Does the design need to fit within a space or facility?YesLayout / General Arrangement Drawing
    Is this a complex product with all of the above?YesFull drawing package, all types working together

    Experienced engineers and CAD teams don’t think in terms of ‘just drawing something.’ They think in terms of what each drawing needs to communicate, and to whom. A detail drawing speaks to a machinist. An assembly drawing speaks to a technician. A schematic speaks to an instrumentation engineer. A layout drawing speaks to everyone in the room.

    The moment you start expecting one drawing type to do another’s job, the communication breaks down, and that breakdown shows up later as rework, delays, or parts that simply do not fit.

    A Note on Standards

    Engineering drawings do not exist in a vacuum. They follow international or regional standards that define everything from line weights and title block formats to how tolerances and symbols are expressed. The two most common frameworks are ASME Y14 (widely used in North America, especially in manufacturing and mechanical engineering) and ISO 128 (dominant in Europe and international projects).

    Understanding which standard your project or client uses matters. A drawing that is perfectly correct under one standard can be ambiguous or misread under another. When working with international suppliers or distributed manufacturing, always state the applicable standard in the title block of every drawing, and verify that all parties are reading from the same convention.

    Common Mistakes When Working With Engineering Drawing Types

    Getting drawing types right is half the battle. These are the most common errors seen when teams misapply or misunderstand their drawing package:

    MistakeWhat Goes WrongHow to Avoid It
    Using a layout drawing instead of a detail drawingThe manufacturer has spatial context but no dimensions, tolerances, or material specs. The part gets made wrong or the shop asks for a complete re-draw.Produce a detail drawing for every unique manufactured component. Layout drawings support coordination, they do not replace manufacturing documentation.
    Expecting one assembly drawing to cover everythingComplex products with dozens of sub-assemblies become unreadable when forced into one drawing. Technicians miss components or misread orientations.Break large assemblies into logical sub-assembly drawings. Each sub-assembly gets its own drawing. The general assembly references them all.
    Confusing a schematic with a wiring diagramA schematic shows logical connections. A wiring diagram shows physical routing. Using one when you need the other causes field installation errors.Use schematics for design and troubleshooting. Use wiring diagrams for physical installation. Produce both for complex electrical systems.
    Mixing drawing standards (ASME vs ISO) in one packageProjection angles, tolerancing conventions, and symbol interpretations differ between standards. Mixed packages create ambiguity that shows up as machined errors.Establish one standard per project and apply it throughout. State the applicable standard in the title block of every drawing.

    Frequently Asked Questions

    1. What is the difference between a detail drawing and an assembly drawing?

    A detail drawing defines how to manufacture a single part, it contains all dimensions, tolerances, and material specifications for that component in isolation. An assembly drawing shows how multiple parts fit together in the final product. It references detail drawings through a parts list but does not contain manufacturing dimensions itself.

    2. Do I need all types of engineering drawings for every project?

    No. The drawing package you need depends on the complexity of your product. A simple machined bracket might only need one detail drawing. A complete industrial machine will need detail drawings for every custom component, assembly drawings at sub-assembly and general assembly level, schematic drawings if it has electrical or pneumatic systems, and a layout drawing if it needs to be integrated into a facility.

    3. What is a P&ID drawing and when is it used?

    A P&ID (Piping and Instrumentation Diagram) is a type of schematic drawing used in process engineering, oil and gas, chemical processing, water treatment, and similar industries. It shows all piping, valves, instrumentation, and control systems in a process, along with how they are interconnected. It is not drawn to scale and does not show physical routing, it communicates system logic.

    4.What standards apply to engineering drawings?

    The two primary frameworks are ASME Y14 (used widely in North America, particularly in manufacturing and mechanical engineering) and ISO 128 (dominant in Europe and international projects). These standards govern projection method, line types, title block content, and tolerancing conventions. GD&T specifically follows ASME Y14.5 or ISO 1101. Always confirm which standard applies before producing or reviewing a drawing package.

    5. What is a general arrangement (GA) drawing?

    A general arrangement drawing, sometimes called a layout drawing, shows the overall spatial organisation of a product, system, or facility. It communicates where everything sits relative to everything else: overall envelope dimensions, major component positions, access clearances, and key interfaces. It is the coordination document used across engineering disciplines and with clients.

    The Bottom Line

    Engineering drawings are the contract between designers and builders. When they are done right, correct type, correct content, correct standard, they eliminate ambiguity and let production move with confidence. When they are done wrong or misunderstood, the costs show up in ways that are rarely traceable back to the drawing itself: defective parts, assembly failures, missed timelines.

    Whether you are building a single custom component or managing a complex multi-discipline project, getting your drawing types right from the start is not a formality. It is a foundation.

    Need Drawings That Work the First Time?
    At Simutecra Engineering Services, our engineering team handles CAD drafting and 3D modeling for mechanical and structural projects of all scales, from individual part drawings to full assembly and layout packages. We produce drawing sets that are correctly typed, correctly formatted, and correctly toleranced from the start.Share your project requirements and we will review your current drawing package or build a new one, the right drawing types, done correctly.
    Reach out to us today, Simutecra