
| ISA 5.1-2024 latest revision of the dominant global P&ID instrumentation standard, reaffirmed with updated tagging conventions for modern DCS and SIS systems 100-300+ typical P&ID sheet count for a single process unit, compared to 10-30 sheets for the equivalent Process Flow Diagram 5 letters maximum tag length in the ISA 5.1 system: first letter (measured variable) plus up to four modifier and function letters Life of plant P&IDs are living documents maintained from FEED through decommissioning, unlike most engineering drawings that are frozen at handover |
Introduction:
If a process plant has one drawing that every engineer, operator, and maintenance technician needs to understand, it is the piping and instrumentation diagram. Walk into any control room in any refinery, chemical plant, water treatment facility, or pharmaceutical manufacturing site and you will find P&IDs on the wall, on screens, and in the hands of the people running the plant.
A P&ID is not a photograph of the plant. It is not a pipe routing drawing. It is not a process overview. It is something more specific and more useful than any of those: it is the complete schematic record of every pipe, every valve, every instrument, and every control connection in a process system, drawn in a standardised symbolic language that anyone trained in the conventions can read, regardless of which plant they are working in or which language they speak.
This guide explains what a P&ID drawing actually contains, how to decode the instrument tag system, what the different symbol shapes mean, how to trace a control loop from measurement to output, and where P&IDs fit in the wider family of process engineering documents. It also covers the most common reading mistakes and where digital P&IDs are heading in 2026.
| Quick definition: A P&ID (Piping and Instrumentation Diagram) is a schematic engineering drawing that shows every pipe, valve, instrument, and control element in a process system. It includes pipe sizes and material specifications, valve types and locations, instrument tags following the ISA 5.1 standard, control loops, and safety systems. P&IDs are used for design, construction, operations, and maintenance throughout the life of a plant. |
What Is a P&ID? The Complete Explanation
A P&ID is a schematic drawing. That single word, schematic, is the key to understanding what it is and what it is not. It shows logical and functional connections between process elements, not their physical positions in the plant. Two pipes shown crossing on a P&ID may be 20 metres apart in reality. A pump shown next to a vessel may have 50 metres of pipework between them on site. The P&ID is not concerned with distance or physical layout.
What it is concerned with is completeness and accuracy of what is connected. Every valve, no matter how small. Every instrument, no matter how minor. Every control signal, every safety device, every isolation point. If it exists in the process system, it appears on the P&ID.
What a P&ID Contains
- All process piping with line numbers that encode pipe size, service, material specification, and insulation requirement
- Every valve shown by type (gate, globe, ball, butterfly, check, control, safety) with its tag number
- All process equipment shown schematically: pumps, compressors, vessels, heat exchangers, columns, reactors
- Every instrument with its ISA tag number identifying what it measures and what function it performs
- All control loops showing the connection from measurement through controller to final control element
- Safety systems including pressure safety valves, bursting discs, emergency shutdown valves, and interlocks
- Utility connections showing how steam, cooling water, instrument air, and nitrogen connect to process equipment
- Battery limits showing where this drawing’s scope ends and the adjacent drawing or system begins
What a P&ID Does NOT Contain
- Physical pipe routing or dimensioned layout (that is the isometric drawing)
- Structural supports, building walls, or topographic information
- Equipment dimensions or installation details (those are equipment general arrangement drawings)
- Electrical wiring detail (that is the electrical schematics and loop drawings)
- Accurate spatial relationships between any components
These exclusions are not limitations. They are the reason P&IDs are so useful. By removing all spatial and dimensional information, the drawing focuses entirely on what matters for process understanding, operations, and maintenance: what exists, how it connects, and how it is controlled.
P&ID vs PFD: Understanding Where Each Drawing Fits
The most common source of confusion when engineers and operators first encounter process plant documentation is the relationship between the Process Flow Diagram and the P&ID. They look superficially similar but serve entirely different purposes.
| Aspect | Process Flow Diagram (PFD) | P&ID |
| Level of detail | High-level process overview | Every pipe, valve, and instrument |
| Pipe information | Major flows only, no sizes | All pipes with size, spec, tag number |
| Valve detail | Major control valves shown | Every valve by type and tag |
| Instrument detail | Key measurements only | Every instrument with tag and loop |
| Safety systems | Not shown | PSVs, ESDs, interlocks all shown |
| Who uses it | Process engineer, project management | All engineering disciplines, operations, maintenance |
| When produced | Early FEED and front-end design | Detailed design through plant life |
| For operations use | Not appropriate for field use | Primary reference for operators |
| For maintenance use | Not appropriate | Isolation planning, lockout/tagout |
| Drawing count (typical) | 10-30 sheets for a process unit | 100-300+ sheets for same unit |
A useful way to think about the relationship: the PFD tells you what the process is supposed to do. The P&ID tells you everything that exists to make it do that. If someone asks why a certain pump is installed, the PFD gives the process logic. If someone asks which valves to close to isolate that pump for maintenance, the P&ID provides the answer.
How to Read P&ID Instrument Tags: The ISA 5.1 System
Every instrument on a P&ID has a tag number. That tag is not arbitrary. It follows a precise coding system defined by ANSI/ISA 5.1, the international standard for instrumentation symbols and identification last revised in 2024. Once you understand the system, you can decode any instrument tag on any P&ID drawn to this standard, in any plant, anywhere in the world.
The Tag Structure
An ISA 5.1 tag has two parts: letters and a number. The letters identify the function. The number identifies the loop.
The letters consist of:
- First letter: the measured or initiating variable. What is being measured. F for Flow. T for Temperature. P for Pressure. L for Level.
- Second letter (modifier or function): adds detail to the first. D means differential. H means high. L means low. I means indicate.
- Third and subsequent letters: the output function. C means control (has a control output). T means transmit (sends a signal). S means switch (has a discrete on/off output). R means record.
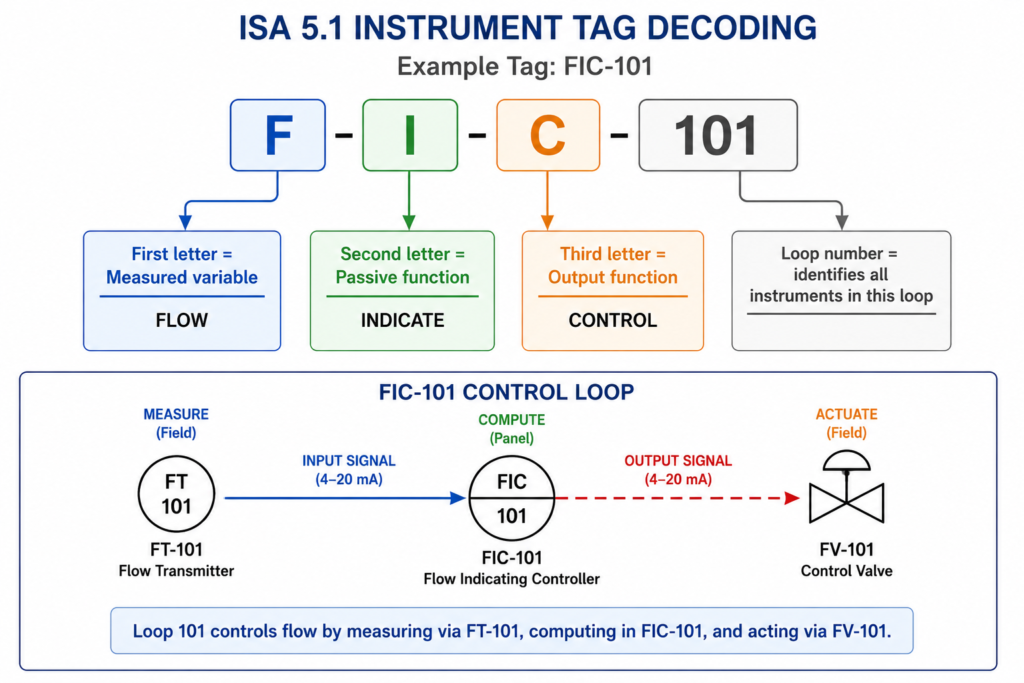
The number identifies the control loop. All instruments sharing the same number belong to the same control loop. FT-101, FIC-101, and FV-101 are all part of loop 101, the flow control loop.
| Letter | Measured variable (first letter) | Modifier (second letter) | Output function (third+ letter) |
| A | Analysis | Alarm | Alarm |
| C | Conductivity | Control | Controller |
| D | Density / specific gravity | Differential | |
| E | Voltage | Sensor / element | |
| F | Flow rate | Ratio | |
| H | Hand (manual) | High | |
| I | Current (electrical) | Indicate | Indicator |
| J | Power | Scan / multipoint | |
| K | Time / schedule | Control station | |
| L | Level | Low | Light |
| P | Pressure / vacuum | Point (test) | |
| Q | Quantity | Integrate / totalize | |
| R | Radiation | Record | Recorder |
| S | Speed / frequency | Safety | Switch |
| T | Temperature | Transmitter | |
| V | Vibration | Valve | Valve (control element) |
| W | Weight / force | Well | |
| X | Unclassified | X-axis | Unclassified |
| Y | Event / state | Y-axis | Relay / compute / convert |
| Z | Position / dimension | Z-axis | Driver / actuator |
Tag Examples You Will Encounter on Real P&IDs
| Tag example | Meaning | Full expansion | Bubble type |
| FIC-101 | Flow Indicating Controller | Flow (F) + Indicate (I) + Control (C) + Loop 101 | Circle (field) |
| PT-202 | Pressure Transmitter | Pressure (P) + Transmit (T) + Loop 202 | Circle (field) |
| TIC-305 | Temp Indicating Controller | Temperature (T) + Indicate (I) + Control (C) + Loop 305 | Circle-line (panel) |
| LT-401 | Level Transmitter | Level (L) + Transmit (T) + Loop 401 | Circle (field) |
| PSV-501 | Pressure Safety Valve | Pressure (P) + Safety (S) + Valve (V) + Loop 501 | Hexagon (SIS) |
| FE-102 | Flow Element | Flow (F) + Sensor/Element (E) + Loop 102 | Circle (field) |
| LSH-403 | Level Switch High | Level (L) + Switch (S) + High (H) + Loop 403 | Circle (field) |
| AIT-601 | Analyser Indicating Transmitter | Analysis (A) + Indicate (I) + Transmit (T) + Loop 601 | Circle (field) |
| The fastest way to read a tag you do not recognise: Split the letters into groups. The first letter always gives the measured variable. Everything after it tells you what the instrument does with that measurement. FT: measures Flow, Transmits the signal. TIC: measures Temperature, Indicates it on a display, Controls a valve. PSV: Pressure Safety Valve. Once you know the first-letter meanings, the rest follows logically. |
Instrument Bubble Shapes: What the Circle Shape Tells You
The tag letters and number sit inside a shape on the P&ID. That shape is called the instrument bubble, and it carries critical information about where the instrument is physically located and what type of system it connects to. An operator or maintenance technician reading a P&ID needs to know not just what an instrument measures, but where to find it in the field or in the control system.
| Symbol shape | What it means | Location | Standard |
| Plain circle | Discrete instrument, field-mounted | Process line or equipment | ISA 5.1 / ISO 10628 |
| Circle with line | Instrument mounted in panel or cabinet | Control room panel | ISA 5.1 |
| Circle with double line | Instrument behind panel or in cabinet | Not directly accessible | ISA 5.1 |
| Circle with dashed line | Shared display or shared controller | DCS or PLC shared system | ISA 5.1 |
| Hexagon | Computer / programmable logic function | DCS, PLC, SIS logic | ISA 5.1 |
| Square / rectangle | Programmable controller or computer | DCS or SCADA system | ISA 5.1 / ISO variant |
| Diamond | Defined in process data or simulation | Process simulation tool | Company-specific |
The distinction between field-mounted and panel-mounted instruments matters operationally. A field transmitter is accessible at the process, where you can see the physical measurement point and the local indicator. A panel-mounted controller is in the control room. When you are planning field work around an instrument, knowing its location type from the bubble shape alone saves a trip to the control room to ask.
P&ID Line Types: Reading the Connections Between Instruments
The lines on a P&ID drawing are not all the same. Different line styles carry different types of signals between different types of elements. Misreading a line type means misunderstanding how an instrument connects to the process or to the control system, which in an operational context leads to wrong decisions about instrument behaviour and loop performance.
| Line type | What it represents | When you see it |
| Thick solid line | Main process pipe carrying the primary fluid | The backbone of any P&ID, carrying process fluid between equipment |
| Thin solid line | Instrument signal line (pneumatic or electrical) | Connecting a transmitter to a controller or indicator |
| Dashed line | Electrical signal (wiring between instruments) | Between field transmitter and DCS input card |
| Dashed and dotted line | Software or data link (Fieldbus, HART, etc.) | Digital communication between field device and control system |
| Dotted line | Hydraulic signal | Hydraulic control line on valve actuator |
| Double line | Jacketed pipe (pipe within a pipe for temperature) | Heat-traced or cryogenic service piping |
| Line with diagonal cross | Capillary tube (filled system) | Thermowell to filled temperature transmitter |
| Thick dashed line | Mechanical link between instruments | Connecting two valves that move together |
| Boundary box (dashed rect) | Battery limit or system boundary | Shows where one P&ID sheet hands off to the next |
Line Numbers: The Data Encoded in Every Pipe Label
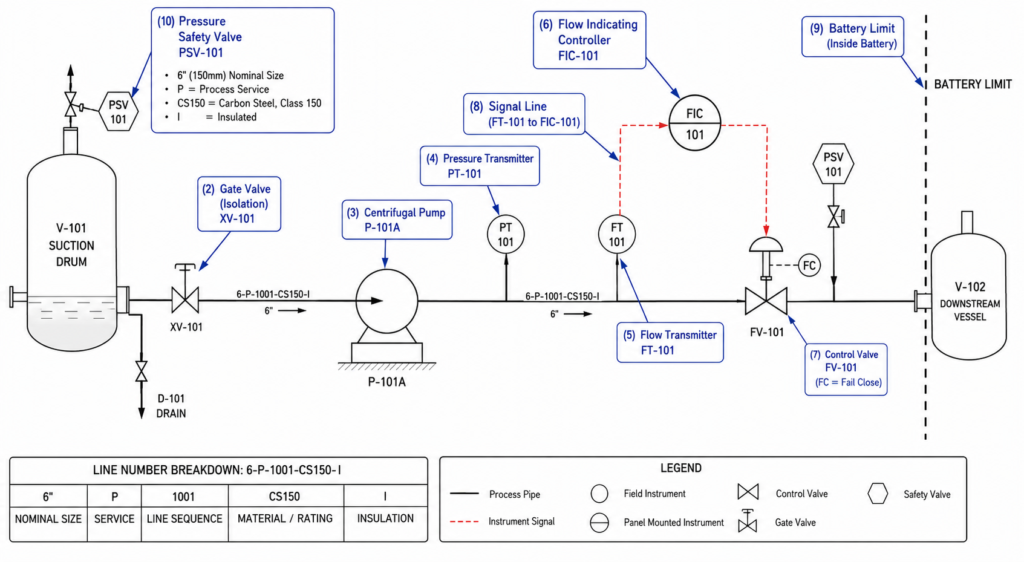
Every process pipe on a P&ID carries a line number, typically formatted as: nominal bore / service code / sequential number / pipe specification / insulation or tracing code.
A line number such as 6-P-1001-CS150-I would decode as:
- 6: 6-inch nominal bore pipe
- P: service code for process fluid (company-specific codes vary)
- 1001: sequential line number within the system
- CS150: pipe specification: carbon steel, Class 150 ANSI flange rating
- I: insulation required
The pipe specification code connects to the piping materials class document, which defines the wall thickness, fitting standards, weld types, gasket materials, and testing requirements for every pipe of that specification class. Without the pipe spec, a piping team cannot make purchasing decisions or specify welds. The P&ID line number is the link that connects the drawing to the piping materials specification system.
Control Loops on a P&ID: Tracing Measurement to Action
A control loop is the complete set of instruments and connections that measure a process variable, compare it to a target, and adjust something in the process to keep the variable at that target. Understanding how to trace a control loop on a P&ID is one of the most valuable skills for anyone working in process operations, instrumentation, or process engineering.
The Three Components of Every Basic Control Loop
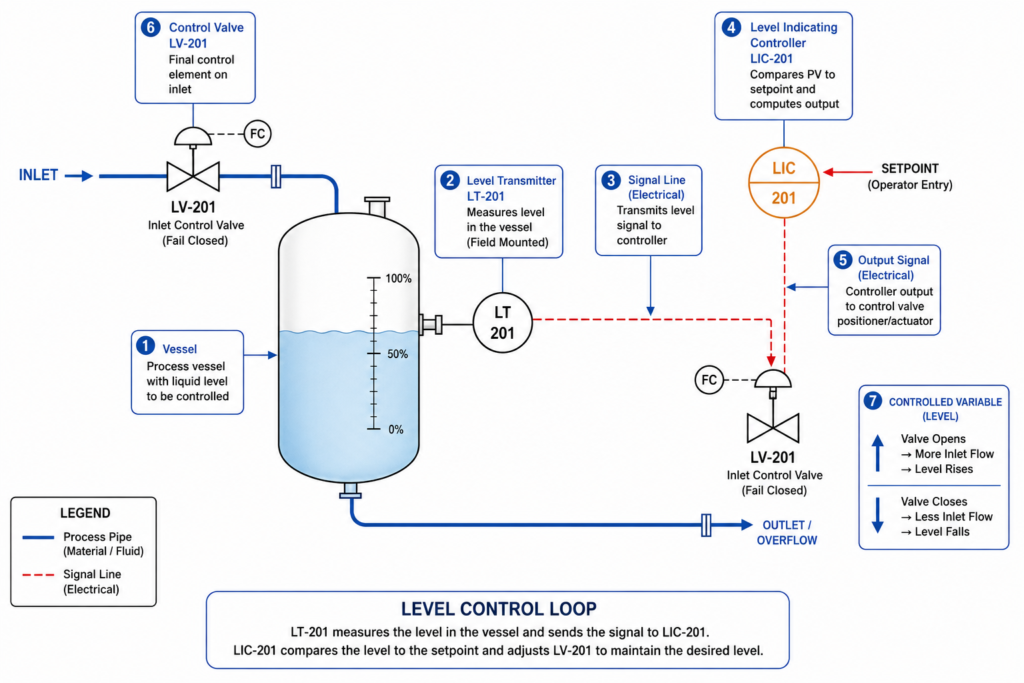
- The measuring element: a sensor or transmitter that reads the process variable. Level transmitter LT-201. Pressure transmitter PT-301. Flow element FE-101. This connects physically to the process pipe or vessel.
- The controller: receives the measurement signal, compares it to the setpoint, and calculates the required output to correct any deviation. LIC-201. FIC-101. These are shown with panel-mounted bubble symbols in most P&IDs, indicating they live in the DCS or control system.
- The final control element: acts on the process. Almost always a control valve (LV-201, FV-101). Occasionally a variable-speed pump drive or an electrical heater. The actuating signal from the controller drives the valve position.
The loop number connects all three. If you see LT-201, LIC-201, and LV-201 on the same P&ID, they are all part of loop 201. Trace the signal lines between them and you have the complete picture of how that measurement drives that valve.
Cascade Control Loops
Some P&IDs show cascade control: one controller’s output becomes the setpoint of a second controller. A temperature controller TIC-401 sets the setpoint of a flow controller FIC-402, which controls a steam valve FV-402. This is shown on the P&ID by the signal line from TIC-401 feeding into the setpoint input of FIC-402, rather than directly to a valve. Cascade loops appear more complex but follow the same tracing logic: follow the signal lines.
Interlocks and Safety Instrumented Functions on P&IDs
Not all control actions are continuous. Some are discrete: if a pressure reaches a certain level, shut a valve. If a level drops too low, trip a pump. These are interlocks and safety instrumented functions, and they appear on P&IDs with specific notation.
Safety instrumented functions (SIFs) are shown with hexagon bubbles in ISA 5.1 notation, indicating they are handled by a Safety Instrumented System (SIS) rather than the regular DCS. A pressure switch PSH-501 triggering an emergency shutdown valve ESDV-501 on high pressure is a typical SIF. The hex bubble on PSH-501 and the notation on ESDV-501 linking it to the SIS logic identify this immediately to anyone reading the P&ID.
| Critical safety reading point: Never plan a maintenance or operational change without first checking whether the instruments or valves involved are part of a Safety Instrumented Function. An SIF has a specific bypass and override procedure defined in the SIS documentation. Bypassing an SIF valve using normal maintenance isolation procedures can inadvertently disable a safety layer that prevents a serious incident. The P&ID is the first place to identify SIF involvement. The hex bubble and SIS loop numbers are the flags to look for. |
Process Equipment Symbols on P&IDs
Process equipment on a P&ID is represented by standardised geometric symbols that indicate the type of equipment without showing its actual physical form. The symbols under ISO 10628 and ISA 5.1 differ in some cases, which is why the legend sheet matters. Here are the most common equipment types and their symbol conventions.
| Equipment type | ISA symbol | ISO 10628 symbol | Notes |
| Centrifugal pump | Circle with arrow | Circle with filled triangle | Arrow shows rotation direction |
| Positive displ. pump | Circle with vertical line | Rectangle with PD notation | Distinguish from centrifugal |
| Compressor | Triangle pointing flow direction | Circle with internal lines | Type noted in tag |
| Heat exchanger | Interlocked circles | Rectangle with crossing lines | Duty noted in line list |
| Vessel / tank | Rectangle or cylinder | Rectangle or cylinder | Internals shown if relevant |
| Column / tower | Tall rectangle with trays | Tall rectangle with trays | Tray numbers sometimes shown |
| Reactor | Rectangle with internal detail | Similar, R-type notation | Reaction type noted |
| Filter / strainer | Distinct shape with mesh lines | Similar | Rating and connection shown |
| Fired heater | Rectangle with flame symbol | Similar | Burner arrangement may show |
| Cooling tower | Trapezoid with wavy line | Similar | Cell count and type vary |
Valve Symbols on P&IDs: How to Tell Every Type Apart
Valves are the most numerous symbols on any P&ID. A single process unit may contain hundreds of valves of different types, each shown with a specific symbol that identifies its physical operating principle. Getting these right is important for maintenance planning, isolation procedures, and procurement.
| Valve type | ISA/ISO symbol | Typical application | Actuator options |
| Gate valve | Two triangles pointing inward | Isolation; fully open or closed only | Manual handwheel |
| Globe valve | Circle between two converging lines | Flow throttling and control | Manual, motor, pneumatic |
| Ball valve | Circle with a bar through it | Fast isolation, quarter-turn | Manual, pneumatic, electric |
| Butterfly valve | Circle with a diagonal bar | Large bore isolation and control | Manual, pneumatic, electric |
| Check valve | Triangle against a stop line | Prevents reverse flow | None (self-actuating) |
| Relief / safety valve | Arrow with spring symbol | Overpressure protection | Self-actuating (spring-set) |
| Control valve | Bowtie (ISA) or rectangle (ISO/DIN) | Automated flow, pressure, level control | Pneumatic, electric, hydraulic |
| Needle valve | Two triangles with fine opening | Fine flow adjustment, sample points | Manual |
| Diaphragm valve | Curved body symbol | Hygienic and corrosive service | Manual, pneumatic |
| Plug valve | Diamond or rectangle body | Multi-port flow diversion | Manual, gear, actuated |
The Control Valve Symbol and Fail Position
The control valve deserves specific attention because it carries more information than any other valve symbol. In ISA 5.1, a control valve body is a bowtie shape. In ISO 10628 and DIN standards, it is a rectangle. The actuator symbol sits on top of the valve body and indicates the actuator type.
Below or adjacent to the control valve symbol, you will see the fail position annotation: FC (fail closed), FO (fail open), or FL (fail last). This annotation defines what happens to the valve if it loses its control signal, whether that is instrument air on a pneumatic actuator or electrical supply on an electric actuator.
FC valves on process streams typically indicate that the closed position is the safer state for that valve if control is lost. FO valves indicate that open is safer. The process hazard analysis drives these decisions, and the P&ID makes the result visible to everyone who reads the drawing.
The ISA vs ISO vs DIN Symbol Difference
This is one of the most practically important points for anyone who works across international projects. The same control valve is drawn three different ways depending on which standard the drawing follows. In ISA 5.1 (North America and parts of Asia), a globe valve looks like a bowtie. In ISO 10628 (international, European), the valve body is a rectangle. In DIN 19227 (historically German, still common in European industrial plants), the symbol is similar to ISO but with stricter actuator notation conventions.
The consequence: a process engineer moving from a North American project to a European plant will initially misread valve types because the symbols for the same valves look different. The solution is always the same: read the legend sheet first. Every P&ID drawing set should have a legend that defines every symbol used, including which standard was applied. Do not assume ISA or ISO without checking the title block.
How to Read a P&ID: A Practical Step-by-Step Approach
Reading a P&ID for the first time is overwhelming. A complex process unit P&ID can contain hundreds of symbols on a single sheet. The approach below makes it manageable.
- Start with the title block and legend. Confirm which drawing standard is applied, which revision you are reading, and what any custom symbols mean. Never skip this step on an unfamiliar drawing set.
- Identify the battery limits. The dashed boundary boxes at the edges of the drawing show where this P&ID connects to the adjacent drawings. Note the connecting line numbers and the sheet references so you can trace flows that cross sheet boundaries.
- Find the main process flow direction. Thick process pipe lines define the primary flow path. Follow the main stream from left to right as a starting orientation. Identify where material enters the drawing and where it exits.
- Identify major equipment. Vessels, pumps, compressors, and heat exchangers are the anchor points. Understand what each piece of equipment does in the process before looking at the instrumentation.
- Trace the pipe line numbers. Read the line number on each pipe. Size, service, spec, and insulation are all encoded. Cross-reference the spec with the piping materials class document if the material selection matters for your task.
- Read the valve types and tags. Identify isolation valves (gate, ball, butterfly) and control valves. Check fail positions on actuated valves. Note block valve arrangements around control valves, which tell you how to isolate the control valve for maintenance.
- Trace the control loops. Starting from any transmitter, follow the signal line to the controller, then from the controller to the control valve. All three will share a loop number. This is the complete picture of one control function.
- Identify safety devices. Look for PSVs (pressure safety valves), bursting discs, and hexagon-bubble SIS instruments. These define the overpressure protection and safety shutdown envelope for the equipment.
- Check utility connections. Identify where steam, cooling water, instrument air, and nitrogen connect to equipment. These are often shown as smaller diameter branch lines off utility headers.
- Cross-reference with the line designation table. The line designation table (also called the line list) holds the full specification for every line number on the P&ID. If you need to know the design pressure, operating temperature, or corrosion allowance for a line, the P&ID line number is the key to finding it in the line list.
| The most useful habit for P&ID reading: When tracing a control loop, put your finger on the transmitter bubble and trace the signal line with your finger all the way to the controller, then to the control valve. Do not let your eye jump ahead. Follow the physical line path on the paper or screen. On complex P&IDs with many overlapping signal lines, it is easy to miss a junction or follow the wrong line branch. Physical tracing prevents the most common reading errors. |
P&ID Software in 2026: From CAD to Intelligent Engineering Databases
The P&ID software market in 2026 splits clearly into two categories: drawing tools that produce P&ID-looking documents, and intelligent engineering databases that happen to display as P&IDs. The distinction matters significantly for how the drawings are maintained and how useful they are beyond the initial design phase.
| Software | Developer | Key strength | Best for | 2026 status |
| AVEVA P&ID | AVEVA | Intelligent P&ID, database-driven | Oil and gas, petrochemical | Industry standard, cloud roadmap |
| SmartPlant P&ID | Hexagon PPM | EPC project database integration | Large capital projects | Rebranding as Hexagon SDx |
| AutoCAD P&ID | Autodesk | DWG-based, familiar interface | Smaller projects, retrofits | Subscription, part of AEC suite |
| CADWorx P&ID | Hexagon/Intergraph | CAD-integrated intelligence | Mid-size process plants | Strong US market presence |
| Bentley OpenPlant | Bentley | 3D-linked, ISO 15926 data | Owner-operators, lifecycle | Strong in energy sector |
| E3.series Process | Zuken | Electrical + process integration | Multidiscipline panel integration | European market focus |
| Lucidchart / Visio | Various | Simple, fast markup tool | Concept and review only | Not intelligent, no database |
| COMOS | Siemens | Multidiscipline lifecycle tool | Chemical, pharmaceutical plants | Strong digital twin integration |
Intelligent P&IDs vs Drawing-Based P&IDs
A drawing-based P&ID, produced in AutoCAD P&ID or a generic diagramming tool, is essentially a sophisticated drawing. The symbols and line numbers look correct. But the drawing has no database behind it. If you want to extract a valve list from it, someone reads the drawing and types a spreadsheet. If you want to find all instruments in loop 101, someone searches the drawing manually.
An intelligent P&ID, produced in AVEVA P&ID, SmartPlant P&ID, or COMOS, is a graphical interface to a database. Every symbol represents a real object in the engineering database. Every tag number is a record with attributes: service, size, material, design pressure, operating conditions, test requirements, spare parts reference. Extract a valve list and the software queries the database directly. Search for loop 101 and every instrument tagged 101 is highlighted automatically.
For large capital projects and operating plants with hundreds of P&ID sheets and thousands of instruments, the difference between these two approaches is the difference between engineering information that supports operations and maintenance and engineering information that becomes progressively less useful as the plant ages and changes are made without updating every affected drawing.
Digital P&IDs and AI in Process Engineering: What Is Changing in 2026
The convergence of intelligent P&ID platforms with digital twin technology and AI processing is one of the more significant developments in process plant engineering in 2026. The P&ID has always been the most information-dense drawing in a process plant. The current trend is making that information actively machine-readable rather than just human-readable.
AI-Assisted P&ID Digitisation
Enormous amounts of process plant documentation exist as scanned paper P&IDs or flat PDF files with no database behind them. AI symbol recognition systems, now commercially available in 2026, can scan these legacy P&IDs, recognise instrument bubbles, valve symbols, equipment shapes, and line connections, and export the results to structured engineering databases at a fraction of the time and cost of manual transcription.
Published research demonstrates automated recognition of P&ID symbols and connection topology at accuracy rates sufficient for engineering validation workflows. The practical use case: a plant built in the 1990s with paper P&IDs can now be digitised into an intelligent P&ID platform in weeks rather than years, giving operators and maintenance teams searchable, linkable drawing data for the first time in the plant’s operational history.
P&IDs Connected to Digital Twins
The ultimate destination for intelligent P&ID data is integration with the plant digital twin: a computational model of the plant that receives live sensor data and can simulate process behaviour, predict maintenance needs, and support engineering change management. The P&ID is the structural map that tells the digital twin what is connected to what. Without accurate P&ID data, the digital twin does not know the topology of the process.
CMMS integration, where digital P&ID systems link directly to Computerised Maintenance Management Systems, is already standard in well-managed operating facilities. Clicking on a pump tag on a digital P&ID opens the maintenance history, spare parts record, and calibration schedule for that instrument directly in the CMMS. This connection is what makes a P&ID a living operational tool rather than a reference document that sits in a filing cabinet.
Using AI for P&ID Documentation
For process engineers and plant documentation teams, AI tools like Claude are being used to accelerate the documentation that accompanies P&ID development: writing process descriptions that explain what each P&ID sheet represents, generating hazard identification checklists from P&ID content, structuring operation procedures that reference specific P&ID elements, and producing training materials that explain control loops and safety functions to operations teams.
The P&ID provides the technical content and structure. AI handles the communication layer: turning that technical content into readable, consistent documentation that supports operator training, management of change procedures, and regulatory submissions.
How Operations and Maintenance Teams Use P&IDs Every Day
Understanding the operational use of P&IDs places the reading skills from the previous sections in their most practical context.
Isolation Planning and Lockout / Tagout
Before any maintenance work on process equipment, the isolation scope must be defined: which valves are closed, which are locked, which instruments are isolated or bypassed. The P&ID is the tool used to identify every isolation point because it shows every valve in the system and its relationship to the equipment being maintained.
A maintenance engineer planning an isolation for a centrifugal pump uses the P&ID to trace the suction and discharge piping, identify the nearest isolation valves, check for any bypass lines that must also be isolated, locate the drain points for de-pressurisation, and identify any instruments connected to the pump system that must be isolated or drained before maintenance begins. All of this information is on the P&ID. Without an accurate, up-to-date P&ID, isolation planning is guesswork.
Fault-Finding and Process Troubleshooting
When a process problem occurs, operators and process engineers use the P&ID to trace the cause. An unexplained flow reduction is traced from the flow transmitter back through the control loop to the control valve, then to the upstream isolation valves, checking whether any component in the loop could explain the observed behaviour. A pressure excursion is traced through the P&ID to identify which protection devices should have activated and which points are connected to the affected system.
This troubleshooting use is why the accuracy of the P&ID is a safety issue, not just a documentation quality issue. A P&ID that does not reflect as-built plant configuration, one where a valve was added or removed without a drawing update, directs operators to non-existent isolation points or fails to show an additional line that provides an unexpected flow path. Outdated P&IDs have been contributing factors in process safety incidents.
10 P&ID Reading Mistakes That Lead to Wrong Decisions
These are the errors that show up most consistently when engineers and operators unfamiliar with P&ID reading attempt to use the drawings for operational or maintenance decision-making. Each one has a direct operational consequence.
| Mistake | Why it matters | How to prevent it |
| Using outdated P&ID revision | You plan maintenance based on wrong valve locations | Always verify drawing revision against the facility document register before any field work. |
| Ignoring the legend sheet | Company-specific symbols misread as standard ones | Read the legend and symbol key first on any unfamiliar drawing set. Never assume standard symbols. |
| Confusing ISA and ISO symbol sets | Globe valve looks like a different valve type | Check the title block for the standard applied. ISA and ISO have significant symbol differences. |
| Treating P&ID as a piping layout | Wrong expectations about physical pipe routing | P&IDs are schematic, not spatial. Use isometric drawings for actual routing and dimensions. |
| Not reading control loop numbers | Instruments in the same loop not identified | The loop number after the letters connects all related instruments. Always trace the full loop. |
| Ignoring fail position on valves | Valve behaviour during shutdown misunderstood | FC (fail closed), FO (fail open), FL (fail last) on actuated valves defines safety behaviour. |
| Not checking battery limit tie-ins | System scope undefined, cross-boundary work missed | Battery limit boxes define where P&ID sheets connect. Always trace to the adjacent sheet. |
| Missing safety instrumented functions | SIF trips and interlock logic not identified | Hexagon symbols and SIS loop numbers flag safety functions. These have priority over all other operations. |
| Reading from left to right only | Control loops missed because instruments branch up | P&IDs are not linear. Follow signal lines in all directions from each instrument bubble. |
| Assuming unlabelled valves are minor | Unlabelled isolation valves can affect LO/TO scope | Every valve on a P&ID is intentional. If it has no tag, it still affects isolation and maintenance planning. |
Conclusion:
Everything in a process plant starts and ends with the piping and instrumentation diagram. It is the drawing that design engineers use to specify every component. It is the document that operations teams use to understand what they are running. It is the reference that maintenance teams use to plan every isolation and every instrument calibration. And it is the record that regulatory bodies and insurance assessors use to verify that the plant is built and operated as designed.
Reading a P&ID fluently takes practice, but the underlying system is logical. The ISA 5.1 tag structure encodes the function of every instrument in a consistent, decodable format. The symbol library distinguishes every valve type and every equipment category. The line notation captures every pipe attribute in a compact reference. The control loop tracing connects measurement to control action in a traceable graphic.
In 2026, P&IDs are becoming more powerful through digitisation: searchable engineering databases, AI-assisted legacy digitisation, digital twin integration, and CMMS linkage that makes the drawing actively useful during operations rather than only during design. The drawings are changing format and gaining machine-readability. The fundamental skill of reading them accurately has not changed and will not change.
Read the legend. Trace the loops. Check the revision. Never assume.
Frequently Asked Questions
What is a P&ID drawing?
A P&ID (Piping and Instrumentation Diagram) is an engineering drawing that shows every pipe, valve, instrument, and control element in a process system. It includes pipe sizes and material specifications, every valve by type and tag number, every instrument with its ISA tag, the control loops connecting instruments to controllers and final control elements, and all safety systems including pressure relief valves and emergency shutdowns. P&IDs are used throughout the life of a plant: during design, construction, operations, and maintenance. They are not spatial drawings. They show what components exist and how they are connected, not where they physically sit in the plant.
How do you read an instrument tag on a P&ID?
An instrument tag on a P&ID follows the ISA 5.1 standard format: letters followed by a loop number. The first letter indicates the measured variable (F for Flow, T for Temperature, P for Pressure, L for Level). Subsequent letters indicate the function (I for Indicate, C for Control, T for Transmit, S for Switch). The number identifies the control loop. So FIC-101 means: Flow (F) + Indicating (I) + Controller (C) in loop 101. All instruments with the number 101 belong to the same control loop. The bubble shape around the tag indicates instrument location: a plain circle is field-mounted, a circle with a line is panel-mounted.
What is the difference between a P&ID and a process flow diagram?
A Process Flow Diagram (PFD) shows the high-level overview of a process: major equipment, main process streams, and key operating conditions. It contains limited valve detail and shows only key instruments. A P&ID shows every pipe with its size, material specification, and insulation requirement, every valve by type, every instrument with its tag and loop number, and all safety systems. A typical process unit might have 10 to 30 PFD sheets and 100 to 300 or more P&ID sheets for the same scope. PFDs are used for process understanding and early design. P&IDs are the primary reference for detailed engineering, construction, operations, and maintenance.
What does fail closed (FC) and fail open (FO) mean on a P&ID valve?
FC (fail closed) and FO (fail open) are fail-safe position designations on actuated control valves. FC means the valve moves to the fully closed position if it loses its actuating signal, whether that signal is air pressure, electrical power, or hydraulic supply. FO means it moves to the fully open position on signal loss. FL (fail last or fail locked) means the valve stays in its last position when signal is lost. These designations define the safe state of the process on instrument or utility failure and are critical information for process hazard analysis, shutdown planning, and operations procedures. Always check the fail position before operating or isolating an actuated valve.
What is a control loop on a P&ID?
A control loop on a P&ID is the complete set of instruments and connections that measure a process variable, compare it to a setpoint, and adjust a final control element to bring the variable to target. A basic loop contains three elements: a transmitter that measures the variable (such as a flow transmitter FT-101), a controller that calculates the required output (FIC-101), and a final control element that acts on the process (a control valve FV-101). All three share the loop number 101. Signal lines on the P&ID connect these elements to show the measurement path from the process to the transmitter, the signal path to the controller, and the output path to the control valve.
Are P&IDs the same as piping drawings?
No. P&IDs and piping drawings serve completely different purposes. A P&ID is a schematic diagram showing what components exist and how they connect functionally. It has no scale, no spatial accuracy, and does not show the physical routing of pipes through the plant. Piping drawings, including isometric drawings and piping general arrangement drawings, show the actual three-dimensional routing, dimensions, support locations, and physical configuration of the pipework. An engineer needs both: the P&ID to understand what is connected and why, and the piping drawing to understand where it physically goes and how to access it in the field.
ISA (International Society of Automation) — ANSI/ISA-5.1-2024 Standard Overview ()
Leave a Reply