A regional health system planning a major renovation of a 1970s-era hospital wing commissioned the design based on the building’s original architectural drawings, supplemented by a handful of field measurements taken during a walkthrough.
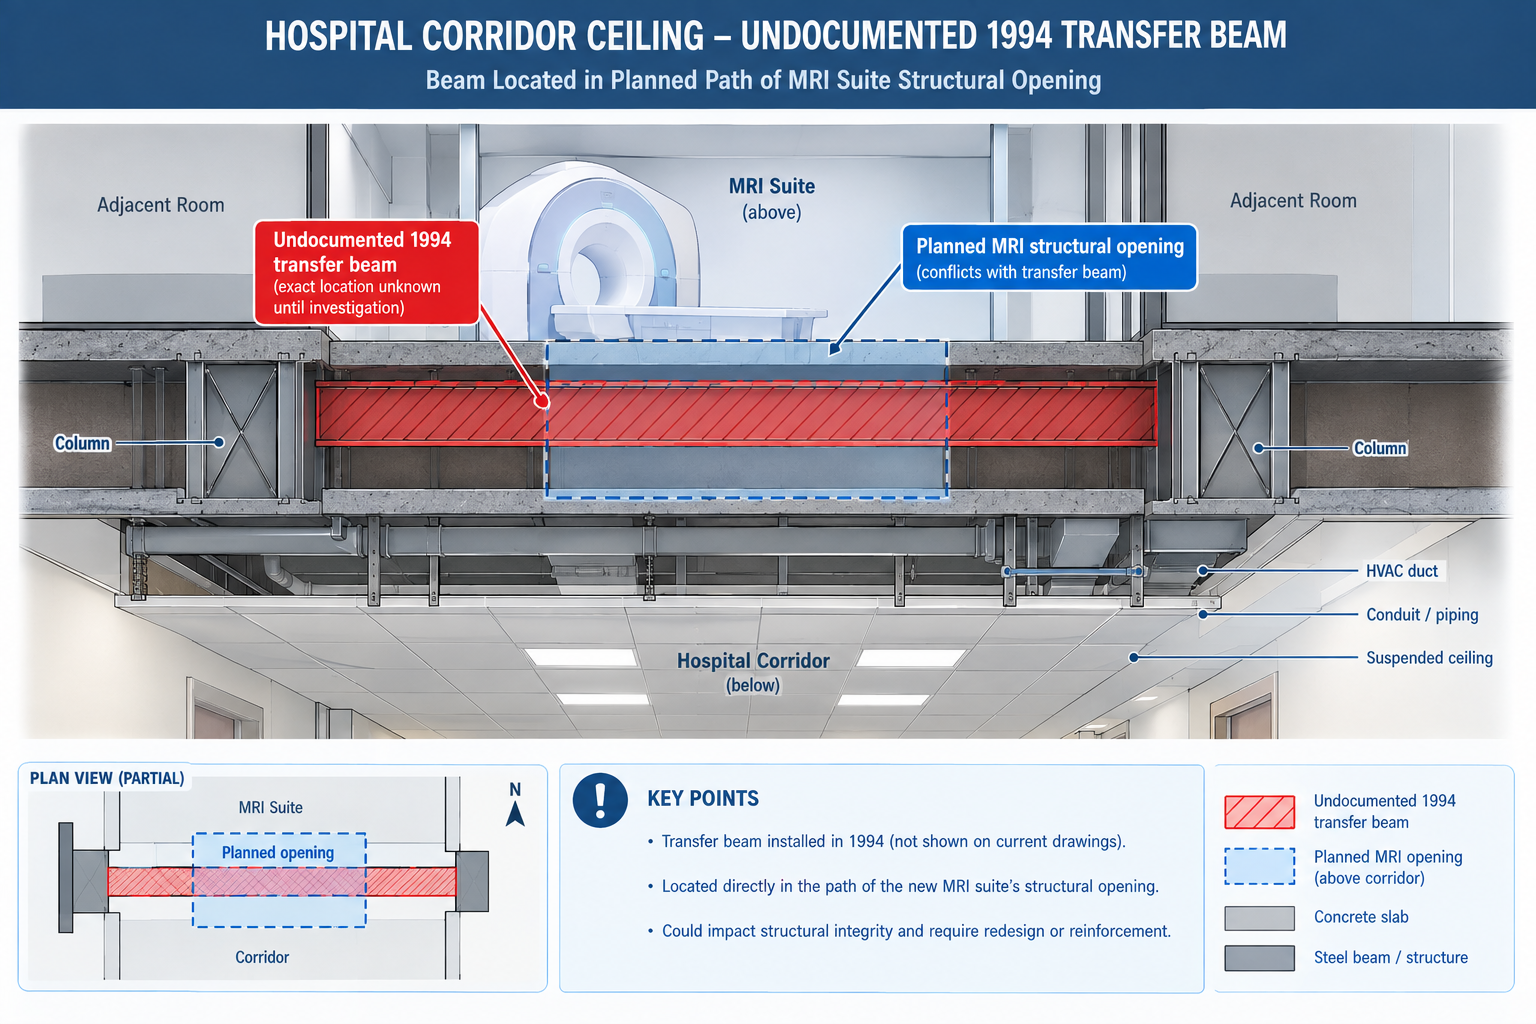
Three weeks into demolition, the contractor discovered a section of corridor ceiling concealed a structural transfer beam that appeared nowhere in the drawings. It had been installed during an unrecorded 1994 renovation to support a rooftop mechanical unit added at that time. The beam sat directly in the path of a new MRI suite’s structural opening, already planned and approved.
Quick answer: The discovery halted demolition for eleven days while a structural engineer assessed the beam, the design was revised around it, and the revision was resubmitted for approval. On an active hospital renovation that had to stay partially operational throughout construction, that delay carried significantly higher cost and disruption than it would have on a vacant building. The beam had been there the entire time. What was missing was a reliable way to capture it before the design was finalised. That’s the gap scan-to-BIM closes: converting a building’s true, current physical condition into an accurate 3D model the design team can trust, instead of relying on original drawings that quietly stopped matching reality years earlier.
This article covers the reality capture technologies used to gather existing-conditions data, the six-stage scan-to-BIM process, the benefits specific to renovation and facilities projects, what drives project cost, and worked examples in practice.
What Scan-to-BIM Actually Is
Scan-to-BIM captures a building’s existing physical condition using 3D reality capture technology, most commonly laser scanning, and converts that data into a structured Building Information Model a design or facilities team can use the same way they’d use a model authored from scratch. The output isn’t the raw scan itself, a point cloud of millions of individually measured 3D points, but a modelled interpretation of it: walls, structure, and MEP systems traced and classified into an organised, element-based model.
The point cloud and the finished model serve different purposes, and a complete deliverable should include both. The point cloud is the unfiltered record of physical reality, every visible surface at true measured accuracy, with no interpretation applied. The finished model is an interpreted simplification built to a defined level of development, so it can be federated and clash-tested using standard BIM workflows. Keeping the point cloud alongside the finished model lets anyone downstream independently verify what the model claims about a specific area, exactly the kind of check that would have caught the concealed hospital beam before, not after, demolition began.
The Reality Capture Technologies Behind Scan-to-BIM
Choosing the wrong technology for a given scope is one of the most common sources of both cost overrun and accuracy shortfall.
Technology
Typical Accuracy
Capture Speed
Best Suited For
Terrestrial laser scanner (tripod)
2-5mm at building-interior range
Slower per setup (2-8 min); many setups for full coverage
The Scan-to-BIM Process: Six Stages From Scope to Handoff
Scan-to-BIM is a structured production process, not a single scanning visit. The finished model’s quality depends as much on the planning and verification stages around the scan as on the technology itself.
Stage
What Happens
Common Pitfall
1. Scope definition and scan planning
Define required accuracy, target LOD, which systems to capture, and the technology mix
Scoping without confirming what the model will actually be used for, causing over-capture or missing detail
2. Field data capture
Crews capture the site, placing control points to tie scans into a consistent coordinate system
Insufficient overlap or control points, leaving gaps or accuracy drift expensive to fix later
3. Registration and point cloud processing
Individual scans are aligned into a single, unified, cleaned point cloud
Accepting a registered point cloud without verifying it against control points, letting errors propagate
4. Model authoring to target LOD
Modellers build the BIM model from the point cloud to the agreed level of detail
Modelling every visible feature indiscriminately instead of to the agreed LOD, producing an oversized, expensive model
5. Quality assurance and accuracy verification
The model is checked against the point cloud and survey control for accuracy and completeness
Skipping independent QA and relying solely on the modelling team’s self-review
6. Deliverable handoff and integration
The model, point cloud, and documentation are delivered and integrated into the project workflow
Delivering the model without the point cloud or QA documentation, leaving the client unable to verify it later
Why Scope Definition Is the Highest-Leverage Stage
Scope definition carries disproportionate weight because it sets the target accuracy and LOD every later stage is measured against. A scope specifying survey-grade accuracy and LOD 350 detail where LOD 200 general planning would suffice spends far more than the project needs. A scope that under-specifies LOD for a project that actually needs coordination-ready detail delivers a model that looks complete but can’t support the workflow the design team needs, forcing a costly re-scope later.
The hospital renovation illustrates getting scope wrong in the other direction. Relying on original drawings and a walkthrough, rather than commissioning any capture at all, is itself a scope decision, one assuming the drawing record was reliable enough to design from directly. For buildings with any unrecorded modification history, that assumption is very often wrong.
The Benefits of Scan-to-BIM, and Where Each One Applies Best
Scan-to-BIM’s benefits concentrate on projects where existing conditions matter and can’t be fully trusted from drawings alone.
Benefit
Mechanism
Best Suited Project Type
Accurate existing conditions for renovation design
Captures true, current geometry instead of relying on outdated or missing drawings
Renovation, retrofit, and adaptive reuse, especially buildings older than 20-30 years
Reduced field verification trips
A complete point cloud eliminates repeated site visits to manually verify conditions
Design teams not co-located with the site, or restricted-access sites
Faster and more reliable design coordination
The as-built model can be clash-tested against new design elements like any discipline model
Renovation projects coordinated using a full BIM workflow
Reduced construction rework from unknown conditions
Conflicts with undocumented existing structure are caught in the model, not by a demolition crew
Any renovation, especially in occupied or operational buildings
Reliable facilities management and space planning data
Gives facilities teams a verified baseline for maintenance and future capital planning
Large portfolios without reliable current documentation
Connecting Scan-to-BIM to the Rest of the Coordination Workflow
A scan-to-BIM model delivers the most value when it’s not treated as a standalone deliverable but federated into the same coordination workflow used for new design: brought into the common data environment as the authoritative existing-conditions reference, clash-tested against new elements, and maintained through construction like an as-built model. Renovation projects that integrate the scan into a full coordination programme capture the benefit twice, once from the accuracy of the capture itself, and again from standard BIM coordination benefits, fewer RFIs, less rework, more reliable scheduling, now extended to a project that would otherwise have had no reliable existing-conditions model at all.
What Drives Scan-to-BIM Project Cost
Cost varies widely by project. A meaningful quote depends on the specific combination of these factors rather than a single per-square-foot number.
Cost Factor
Description
Why It Varies
Building size and site complexity
Total floor area and physical complexity, often the single largest cost driver
Open, simple spaces need fewer scan setups per unit area than congested, MEP-dense spaces
Required accuracy and LOD
Higher accuracy and target LOD need slower scanning and significantly more modelling time
Modelling time scales non-linearly with LOD; each added level needs proportionally more verification
Site access and operating conditions
Occupied, hazardous, or restricted sites slow field capture and may need off-hours scanning
Restricted access reduces effective scanning hours per day and adds safety/escort requirements
Element categories and system detail required
Architectural-only versus full MEP-inclusive scope with ductwork and piping modelled
MEP systems are geometrically dense and often partially concealed, needing more careful interpretation
Deliverable format and software compatibility
The required authoring platform, classification standard, and integration needs
Providers experienced with a client’s specific platform work faster than those adapting for the first time
Weighing Scan-to-BIM Cost Against the Cost of Not Doing It
The more consequential comparison for most project decisions is against the cost of proceeding without a scan, relying on outdated drawings and field measurement, as the hospital renovation did. The eleven-day delay from the concealed beam, on an occupied hospital renovation, almost certainly cost more than a full scan of the affected wing would have. That comparison typically holds for any renovation of meaningful scope: weigh the cost of scan-to-BIM against the cost of the specific field discoveries and redesigns it’s likely to prevent, not as a standalone expense. Buildings with a long, undocumented modification history are where this comparison most reliably favours commissioning the scan.
Worked Examples
A historic theatre renovation: A 1920s-era theatre undergoing a seismic retrofit and accessibility renovation had no reliable original drawings, having been renovated at least four times with no consistent as-built record surviving. The retrofit design depended on knowing exactly how the existing structure was configured, not an assumed condition.
The project commissioned a terrestrial laser scan of the entire building, prioritising survey-grade accuracy for the seismic engineering use case, combined with drone photogrammetry of the exterior facade and roof. The point cloud was modelled to LOD 300 for structural elements and LOD 200 for architectural finishes not relevant to the seismic scope, a deliberately mixed-LOD approach matched to how each part would actually be used.
The scan revealed that a section of the original timber roof structure had been partially reinforced with steel during an undocumented 1960s repair, a condition the structural engineer needed to correctly model the existing structure’s seismic behaviour. Designing the retrofit without this information risked a design that misjudged the structure’s actual capacity. The scan-to-BIM model became the structural engineer’s primary reference for the entire retrofit, replacing the unreliable drawing record entirely.
A manufacturing facility equipment relocation: A manufacturing company relocating a production line within an existing 1980s facility needed to verify that new equipment, with specific clearance requirements, would fit within an existing bay alongside structural columns, overhead crane rails, and utility routing, none of it documented in drawings that predated at least three prior equipment changes in the same bay.
A handheld SLAM scan captured the full production bay in under two hours, prioritising speed over survey-grade accuracy since the use case was equipment fit and clearance checking, not structural design. The point cloud was modelled to LOD 200-300, sufficient to run a clearance check without the cost of a survey-grade capture the project didn’t need.
The clearance check identified that the new equipment’s largest component wouldn’t clear an existing overhead crane rail bracket by the margin the manufacturer’s installation requirements specified, a conflict invisible in the facility’s outdated drawings, which didn’t reflect the bracket’s actual as-installed position after a prior modification. Catching the conflict before equipment delivery let the facility relocate the bracket during a scheduled maintenance window rather than during the tightly scheduled production line changeover, avoiding unplanned downtime.
Frequently Asked Questions
How accurate does a scan-to-BIM model need to be?
It depends on the use case. Structural or seismic engineering, precision MEP coordination, and historic preservation typically need survey-grade accuracy (a few millimetres) from terrestrial laser scanning. General space planning and equipment clearance checks often only need 10-30mm accuracy, achievable faster with handheld SLAM scanning. Define the required accuracy before selecting the technology, rather than defaulting to the highest accuracy available.
Can scan-to-BIM be used for an entire building, or only specific areas?
Both are common. A full-building scan fits a renovation spanning the whole building or an owner wanting a complete facilities record. A targeted scan of specific floors or systems fits a limited project scope, like the manufacturing example here. Scoping the capture area precisely to what’s needed is one of the most effective ways to manage cost without sacrificing accuracy.
How long does a typical scan-to-BIM project take from field capture to finished model?
Field capture is often the fastest stage, from a single day for a small space to several weeks for a large or access-restricted building. Registration, modelling, and QA typically take substantially longer, often several times the field capture duration, since modelling to a coordination-ready LOD is a detailed manual process. Confirm the modelling and QA timeline with the provider based on the specific scope and target LOD.
Is scan-to-BIM only useful for renovation projects, or does it have a role in new construction too?
It has a role in new construction as well: capturing as-built structural or MEP work before it’s concealed by later construction, verifying fabricated components match design models within tolerance, and documenting final as-built conditions for facilities handover. The core value, replacing an assumed condition with a verified, measured one, applies any time there’s meaningful uncertainty about what’s actually built or what exists.
What should a client look for when selecting a scan-to-BIM provider?
Look for experience with the specific scanning technology the project needs, since not every provider is equally strong across terrestrial, SLAM, and photogrammetry capture. Check for a documented accuracy verification process, ideally a QA report comparing the model against survey control. Confirm they’ll deliver the underlying point cloud alongside the finished model, not just the model itself, so the accuracy can be independently verified.
Key Takeaways
The concealed hospital beam, the undocumented theatre reinforcement, and the relocated crane rail bracket share a common thread: each was a physical condition that existed on site, invisible in the available drawings, found either expensively during construction or affordably during design depending on whether the project had commissioned an accurate capture beforehand. None of these discoveries needed unusual diligence to catch once a scan-to-BIM model existed; each was a straightforward measurement once the building’s true condition was actually captured rather than assumed from a drawing record that had quietly stopped being accurate.
This is the core case for scan-to-BIM on any project involving an existing building. Original drawings and even careful field measurement can’t reliably substitute for a systematic, verified capture of current conditions, particularly for buildings with any undocumented modification history, which describes the large majority of buildings more than a decade or two old, a gap the reality capture guidance in the GSA BIM Guide for 3D Imaging was specifically developed to address for institutional projects.
The six stages covered here, scope, capture, registration, modelling, QA, and handoff, exist to convert that physical reality into a model reliable enough to design and coordinate against, with the same confidence a design team would have working from a model of a building that doesn’t yet exist.
Weighed against the cost of the field discoveries, redesigns, and schedule delays it prevents, scan-to-BIM is rarely the most expensive line item on a renovation budget. It’s one of the more reliable ways to make sure the rest of that budget is spent designing and building against what’s actually there, rather than against what an old drawing set assumed still was.
The geometry was perfect. It had been built by an experienced CAD designer who understood the manufacturing process, modeled every fillet to the correct radius, and exported a clean, watertight solid body that meshed without errors. The mesh quality metrics were excellent, Jacobian above 0.85, aspect ratio below 4:1 throughout, convergence confirmed with three mesh refinements. The boundary conditions matched the physical test setup. The material properties were from the certified material datasheet. Every box on the preprocessing checklist was checked.
The simulation predicted a maximum stress of 187 MPa at the shaft shoulder. The shaft yielded at 220 MPa. The safety factor appeared to be 1.18, adequate for a non-critical application. The shaft failed in fatigue after 80,000 cycles. The laboratory fatigue test, run afterward to investigate the failure, showed a fatigue life of 85,000 cycles, consistent with the physical failure. The simulation had predicted 187 MPa of peak von Mises stress.
The fatigue analysis used that number. What neither the simulation setup nor the fatigue analysis had accounted for was that the correct fatigue-driving stress was the signed maximum principal stress amplitude, and under the combined bending and torsion loading, the maximum principal stress amplitude was 312 MPa, not 187 MPa. The safety factor was not 1.18. It was 0.71.
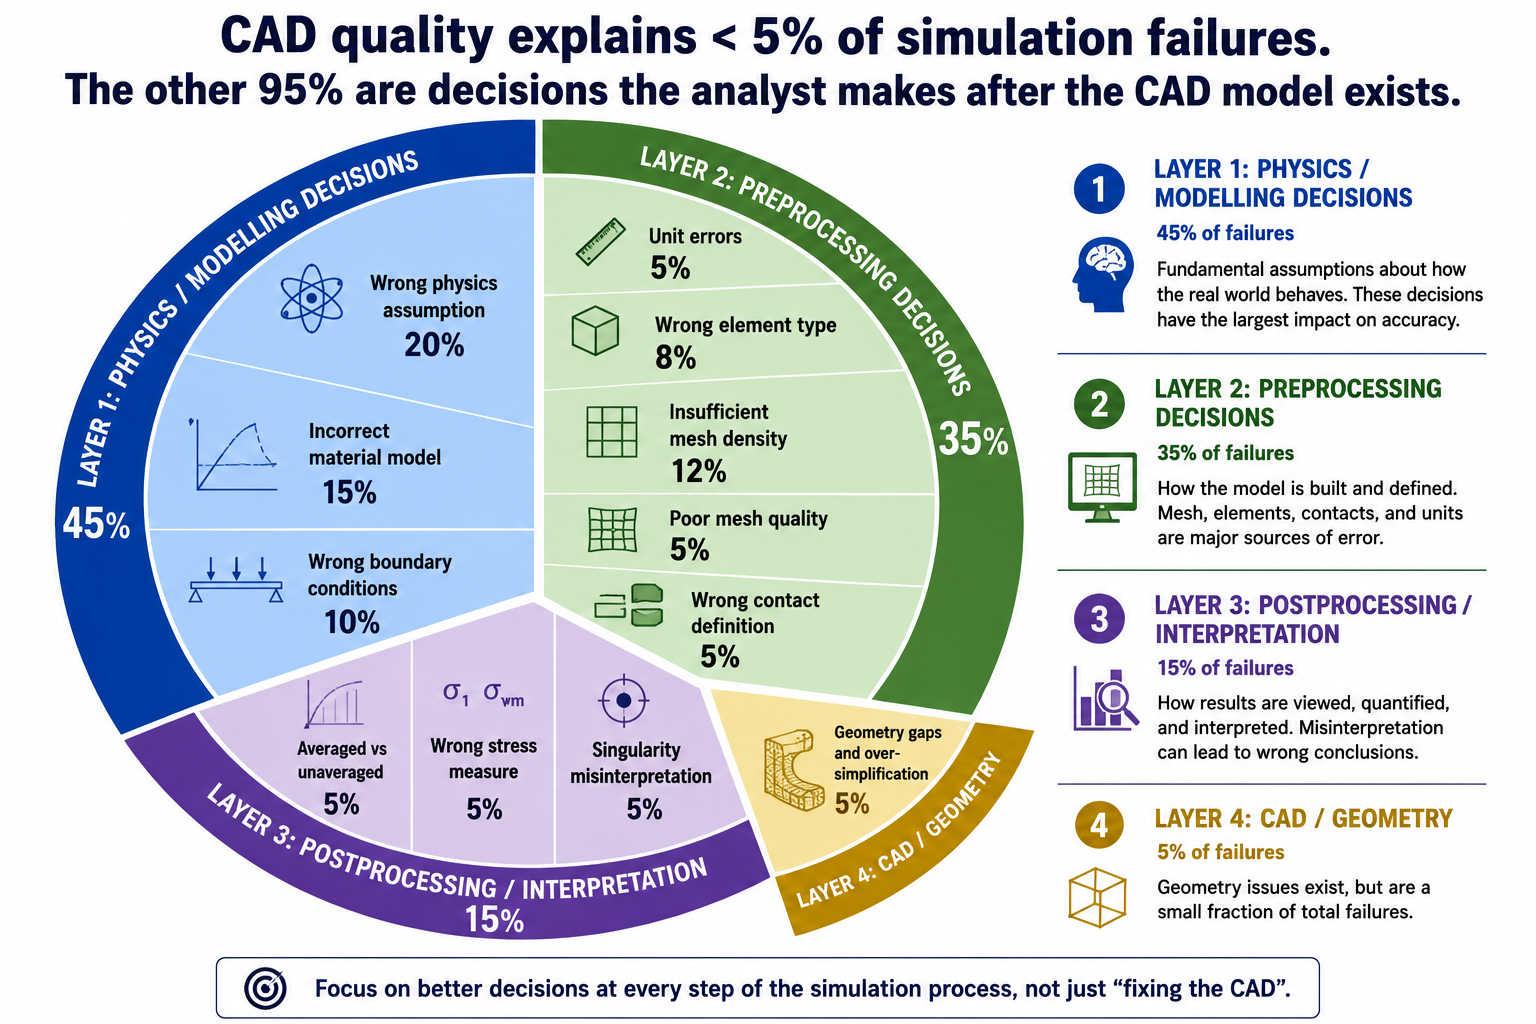
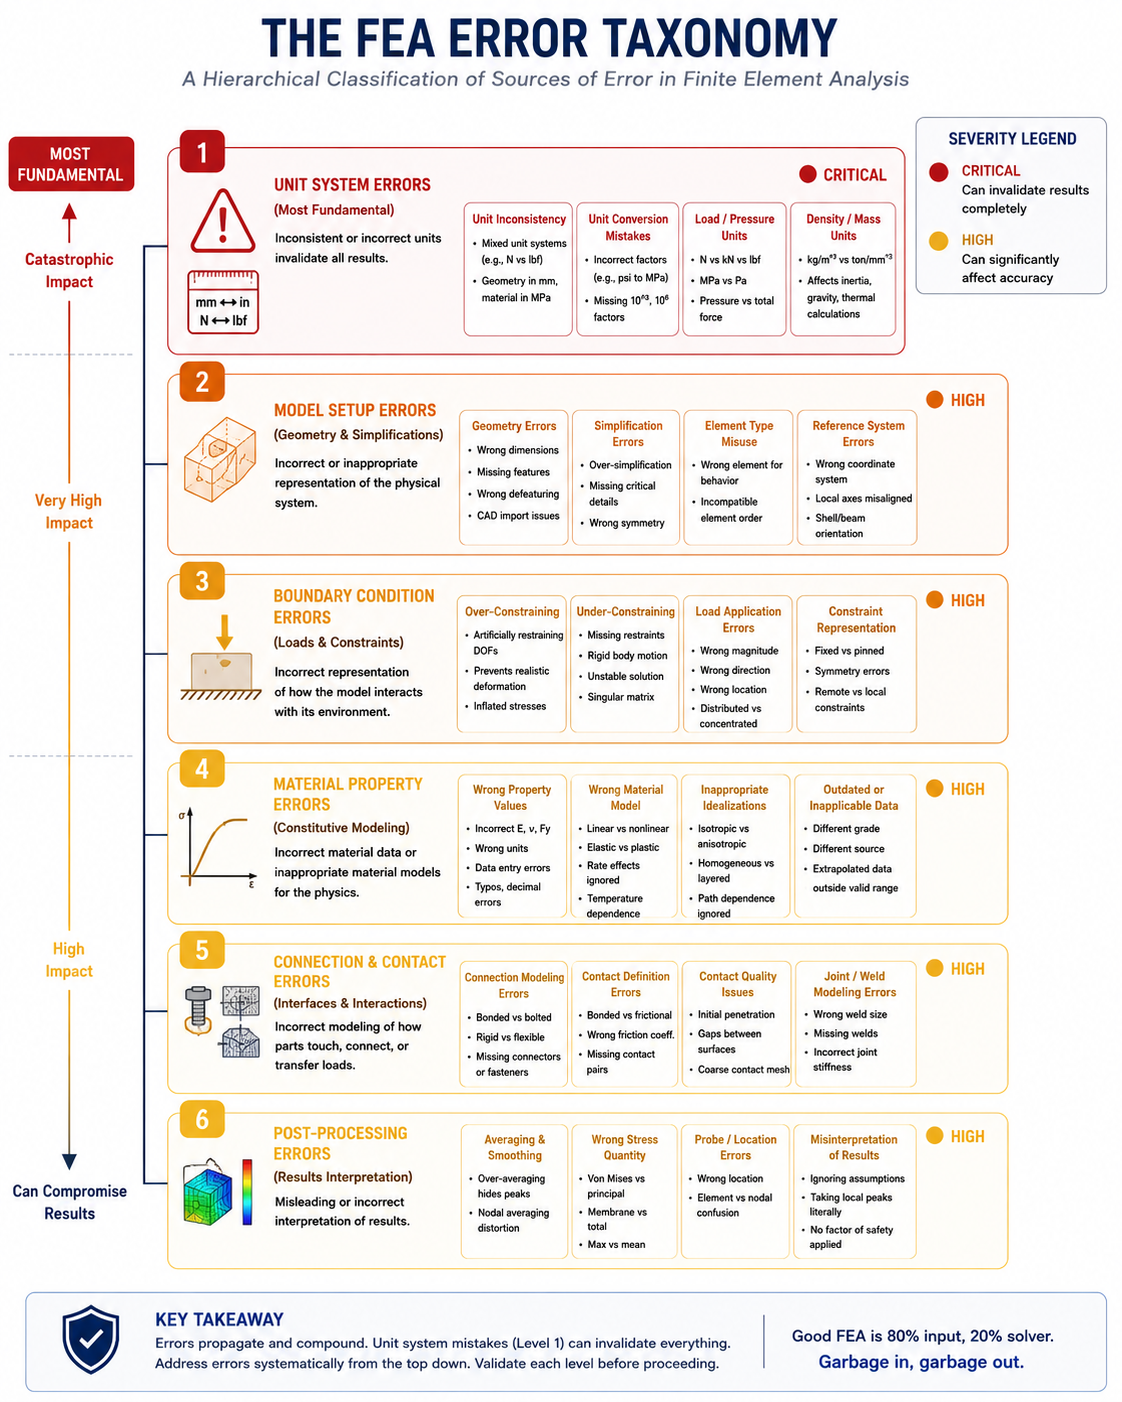
The failure was not caused by bad CAD. It was not caused by a mesh problem. It was not caused by wrong boundary conditions or incorrect material properties. It was caused by misidentifying which stress quantity drives fatigue failure, a postprocessing interpretation error that is entirely independent of the quality of the CAD model, the mesh, or any other preprocessing decision. This is the central reality of simulation accuracy: the overwhelming majority of simulation failures occur in the decisions the analyst makes about physics, modeling approach, and results interpretation, not in the geometric representation of the part.
This article catalogs the twelve categories of simulation failure beyond geometry quality, provides the complete physics assumption error table for structural FEA, the eight most common postprocessing interpretation mistakes and how to avoid them, and the validation methods that catch errors before they propagate to wrong design decisions. The goal is a framework for understanding why simulation fails when the CAD model is not the problem, which is most of the time.
The Complete Taxonomy of Simulation Failure
Simulation failure, producing a result that does not represent the physical behavior of the structure, occurs at four distinct layers: physics and modelling decisions, preprocessing decisions, solver numerics, and postprocessing and interpretation. CAD geometry quality is a subset of preprocessing decisions and, when it is the problem, it typically manifests as mesh generation failure (which is obvious) or poor mesh quality (which is caught by quality metrics). The subtle failures, the ones that produce plausible-looking wrong results, occur almost entirely in physics assumptions and postprocessing interpretation, two layers that are completely independent of CAD quality.
Failure Category
Root Cause Layer
CAD Quality Relevant?
Typical Error Magnitude
Detection Method
Wrong physics assumption
Modelling, analyst decision
No
50% to orders of magnitude, depends on how wrong the physics model is
Comparison with analytical solution or independent simulation using different physics
Incorrect material model
Modelling, data input
No
5% to 10x, linear vs nonlinear material can differ by factor of 3-10 at high loads
Material model sensitivity study; comparison with coupon test data
Wrong boundary conditions
Modelling, analyst decision
No
20% to 10x, fixed vs pinned changes bending moment distribution completely
BC sensitivity study; reaction force equilibrium check; deformation shape inspection
Incorrect load definition
Modelling, analyst decision
No
Up to 100%, wrong direction inverts sign of all results; wrong area changes magnitude proportionally
Load verification against specification; reaction sum check
Unit system inconsistency
Preprocessing, data entry
No
Factor of 10^3 to 10^9, material property in wrong units
Unit verification test (cube under unit load); modal frequency check
Wrong element type
Preprocessing, analyst decision
No
10% to 50%, TET4 vs TET10 at stress concentrations; shell vs solid for thick sections
Element sensitivity study; compare with known analytical solution
Mesh convergence study; compare peak stress across three mesh refinements
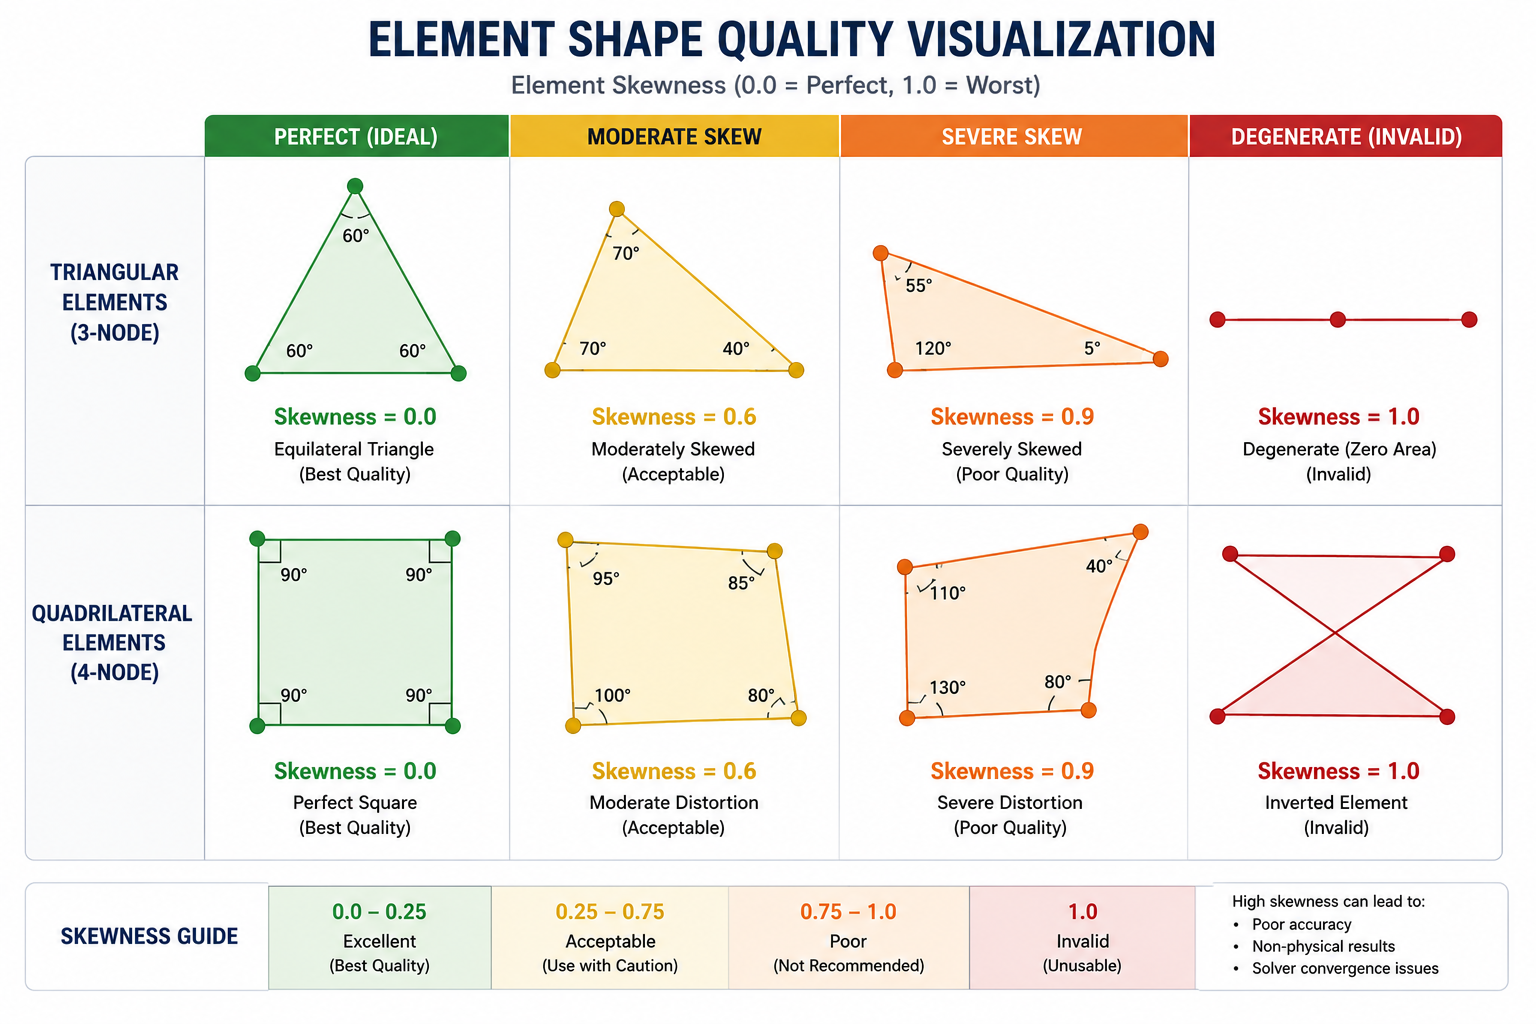
Poor mesh quality
Preprocessing, mesh generation
Partially, bad CAD produces bad meshes
5% to 30% from Jacobian and aspect ratio degradation
Mesh quality metrics check (Jacobian, aspect ratio, warpage) before solve
Missing geometry features (over-simplification)
Preprocessing, geometry
Partially, depends on what was removed
10% to 5x, removing a load-path fillet removes the stress concentration entirely
Compare simplified model stress with full-geometry model at critical features
Incorrect contact definition
Preprocessing, analyst decision
No
10% to complete loss of load transfer, gap in contact allows interpenetration
Contact force output; check interface stress continuity; gap inspection
Numerical solver error (ill-conditioning)
Solver, numerical
No
Small to large, depends on conditioning number of stiffness matrix
Condition number check; residual force check; solver diagnostic output
Misinterpretation of results
Postprocessing, analyst decision
No
Up to 100%, von Mises used when principal stress is needed; averaged vs unaveraged stress
Results interpretation protocol; independent reviewer; hand calc comparison
The most important column in this table is the third: ‘CAD Quality Relevant?’, which is ‘No’ for ten of twelve failure categories. Nine of the twelve failure categories are entirely independent of the CAD model quality. The two categories where CAD quality is partially relevant (poor mesh quality and missing geometry features from over-simplification) can also arise from analyst decisions independent of the original CAD. The implication is direct: improving CAD quality addresses at most 5 to 10 percent of the sources of simulation failure. The other 90 to 95 percent require better physics judgment, more rigorous preprocessing practice, and more systematic results validation.
Category 1: Physics Assumption Errors, The Most Consequential Failures
Physics assumption errors are the simulation failures that produce the largest discrepancies between predicted and actual behavior. They occur when the analyst selects an analysis type, material model, or physical representation that is fundamentally inappropriate for the actual physics of the problem. Unlike mesh density errors, which typically produce 5 to 40 percent discrepancies that systematic mesh refinement will reveal, physics assumption errors can produce results that are wrong by factors of 2 to 50 or more, with no indication from the solver that anything is amiss
The solver cannot detect a physics assumption error. If the analyst sets up a linear elastic static analysis for a structure that actually yields, creeps, and collapses dynamically, the solver applies linear elastic statics faithfully and returns a result that is internally consistent with those assumptions. The result looks exactly like a valid FEA output. The error is in the question that was asked, not in the computation of the answer
Wrong Assumption
What It Misses
Correct Approach
How to Detect
Linear elastic material when plastic deformation occurs
Stress redistribution after yielding; residual stresses; collapse load prediction
Nonlinear material model with isotropic or kinematic hardening
Check if any element von Mises stress exceeds yield, if so, linear analysis is invalid at those locations
Static analysis when load is dynamic
Inertia amplification (DAF up to 50x at resonance); resonance; transient effects
Modal analysis to find natural frequencies; harmonic or transient analysis
Calculate frequency ratio f_load/f_nat, if > 0.3, dynamic analysis required
Small displacement (linear geometry) when deformation is large
Geometric stiffening (cables, membranes); change in load direction with deformation; snap-through instability
Nonlinear geometry (large displacement) analysis
Check if peak displacement exceeds ~5% of characteristic structure dimension
Isotropic material for composite or anisotropic structure
Direction-dependent stiffness and strength; interlaminar shear; ply-by-ply stress
Orthotropic or anisotropic material model with correct fiber orientations
Check material data, if E varies by direction, isotropic is wrong
Frictionless contact when friction governs load transfer
Friction force component; load distribution change with friction; stick-slip behavior
Frictional contact with measured or estimated friction coefficient
Check if tangential force at interface is significant relative to normal force
Room temperature material properties for elevated temperature service
Stiffness reduction (steel: -30% at 400°C); yield stress reduction; creep at sustained high temperature
Temperature-dependent material properties; separate thermal analysis to determine temperature field
Check operating temperature, if > 200°C for steel or > 100°C for aluminum, temperature effects are significant
Perfect bond at all interfaces (all tied contact)
Partial separation; interface slip; peel stress at bond terminations; delamination in composites
Contact with separation allowed; cohesive zone model for bond/adhesive
Check if interface peel or shear stress exceeds adhesive or bond strength
Single load path (ignoring redundancy or alternative paths)
Load redistribution after local yielding; progressive failure sequence; fail-safe load paths
Nonlinear analysis capturing load redistribution; or explicit multi-path structural model
Check if structure has any redundancy, if hyperstatic, linear analysis misses redistribution
The Linear Elastic Trap: When Yielding Changes Everything
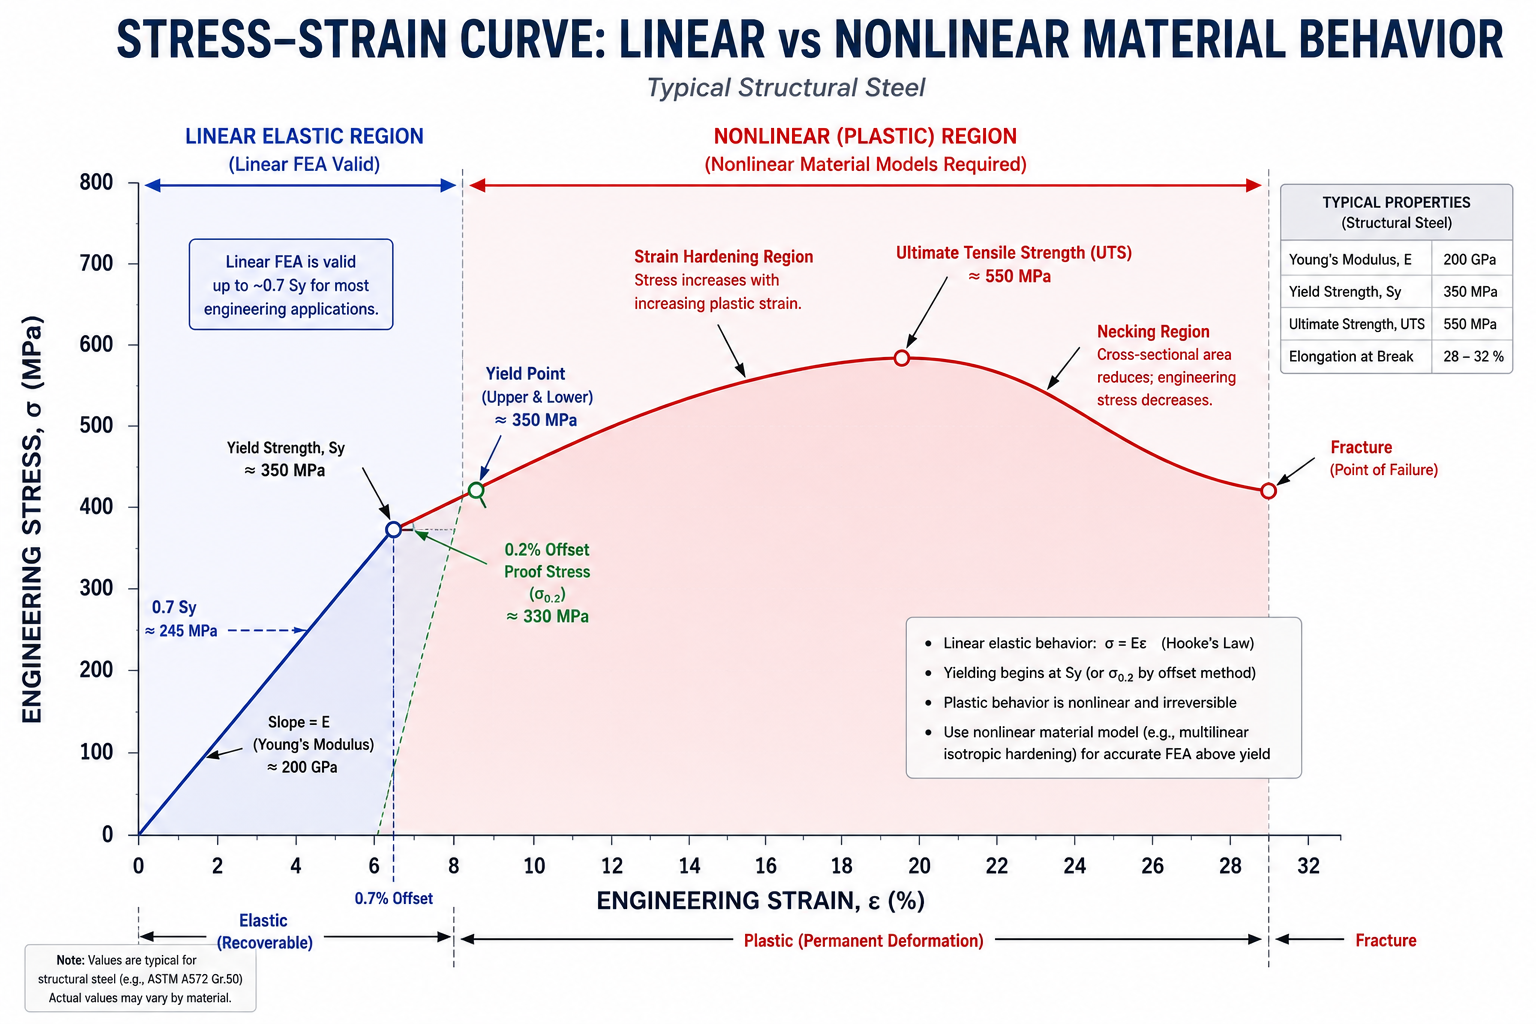
The most common physics assumption error in industrial FEA is the application of linear elastic analysis to structures that yield locally under the applied loads. In linear elastic analysis, stress is proportional to strain everywhere, there is no yielding, no stress redistribution after yielding, and no limit on how high the stress can go. When an element in the model reaches the yield stress, the linear analysis simply continues computing higher stresses as if the material were still elastic.
In ductile materials, local yielding at a stress concentration does not usually cause immediate failure. Instead, the yielded region redistributes load to the surrounding elastic material, limiting the peak stress to approximately the yield strength (plus any strain hardening) and allowing the structure to carry additional load. As a result, linear elastic FEA is conservative for local stress prediction because it can predict stresses above the material’s yield strength, but non-conservative for overall structural behavior because it ignores the beneficial load redistribution that occurs after yielding. Using linear elastic stress results for fatigue analysis in components that experience local yielding can therefore produce misleading results by overestimating local stresses while failing to capture the actual stress distribution.
Large Displacement Effects: When Geometry Changes Under Load
Linear FEA assumes that displacements are small relative to the structure’s dimensions, specifically, that the displaced configuration is so close to the undeformed configuration that the stiffness matrix computed for the original geometry remains valid throughout the loading. This assumption breaks down when displacements exceed approximately 5 percent of the characteristic structural dimension.
Ignoring large displacement effects can produce fundamentally incorrect results. In cables and membranes, geometric stiffening from tension creates the structure’s load-carrying stiffness, which linear analysis cannot capture. In slender columns, geometric softening leads to buckling, while in shallow arches and buckled plates, it governs snap-through instability. These critical behaviors are only predicted with geometric nonlinear analysis.
Temperature Effects: The Invisible Load
Thermal stress is one of the most systematically ignored physics effects in structural FEA. When a structure operates at elevated temperature, or when temperature varies across the structure (as in a heat exchanger, an engine component, or a solar panel), the differential thermal expansion between constrained regions produces stress that can be comparable to or larger than the mechanical stress from applied loads. A steel component that is mechanically unstressed but subjected to a temperature difference of 100°C across a constrained length generates thermal stress of approximately E x alpha x delta_T = 210,000 x 12e-6 x 100 = 252 MPa, close to the yield stress of mild steel, from thermal load alone.
The error of ignoring thermal stress is particularly dangerous in systems that operate under combined mechanical and thermal loading. A pressure vessel at room temperature may have a mechanical stress of 150 MPa against a yield stress of 350 MPa, a safety factor of 2.3. The same vessel at 350°C may have a yield stress of 250 MPa (elevated temperature reduction) plus a thermal stress from the temperature gradient of 100 MPa, reducing the margin to: 350 – 150 – 100 = 100 MPa remaining against 250 MPa yield, an effective safety factor of 1.67 rather than 2.3, and a reduction the mechanical-only analysis would never reveal.
Category 2: Material Model Errors, When the Wrong Data Drives the Analysis
Material model errors span two distinct failure modes: using the wrong material model type (linear elastic when the material is nonlinear, isotropic when it is anisotropic) and using wrong material data values within the correct model type. Both produce results that are wrong but internally consistent, the solver is computing correctly, but it is computing the response of a different material than the one in the actual structure.
The Datasheet vs Design Allowable Distinction
Material datasheets report properties measured on laboratory specimens under idealized conditions: polished surface finish, controlled grain direction, room temperature, no stress concentrations. These are not the design allowable values for structural components. The design allowable, the property value that should be used in a structural analysis to achieve a specified probability of failure, is lower than the datasheet nominal value by factors that account for material variability, environmental effects, product form differences (plate vs forging vs casting), and surface finish.
In aerospace, material allowables are defined by the MMPDS as A-basis (99% population with 95% confidence) and B-basis (90% population). These values are often 10–40% lower than nominal datasheet properties to account for material variability. Using nominal values instead of certified allowables in safety-critical FEA can produce non-conservative results and compromise structural integrity.
Weld and Heat-Affected Zone Properties
Welded structures present a material modeling challenge that is systematically underestimated: the weld metal and the heat-affected zone (HAZ) adjacent to the weld have different mechanical properties from the parent material. For structural steels, the HAZ may have lower toughness than the parent plate (due to heat-induced grain coarsening) while having similar or slightly higher yield stress. For aluminum alloys, the HAZ is typically significantly weaker than the parent material, the peak hardness in the HAZ of a 6061-T6 weld can be 50 percent of the parent material value, equivalent to the O (annealed) temper.
FEA models of welded structures that assign parent material properties to the entire geometry, including the weld zone and HAZ, overestimate the strength at the weld and underestimate the failure risk at the heat-affected zone. For aluminum welded structures in particular, the correct approach is to model the HAZ as a separate material zone with reduced properties, sized according to the heat input and the material’s heat treatment response. The width of the softened HAZ in 6061-T6 aluminum is typically 15 to 25mm on each side of the weld centerline.
Category 3: Boundary Condition and Load Errors, Same Model, Different Answer
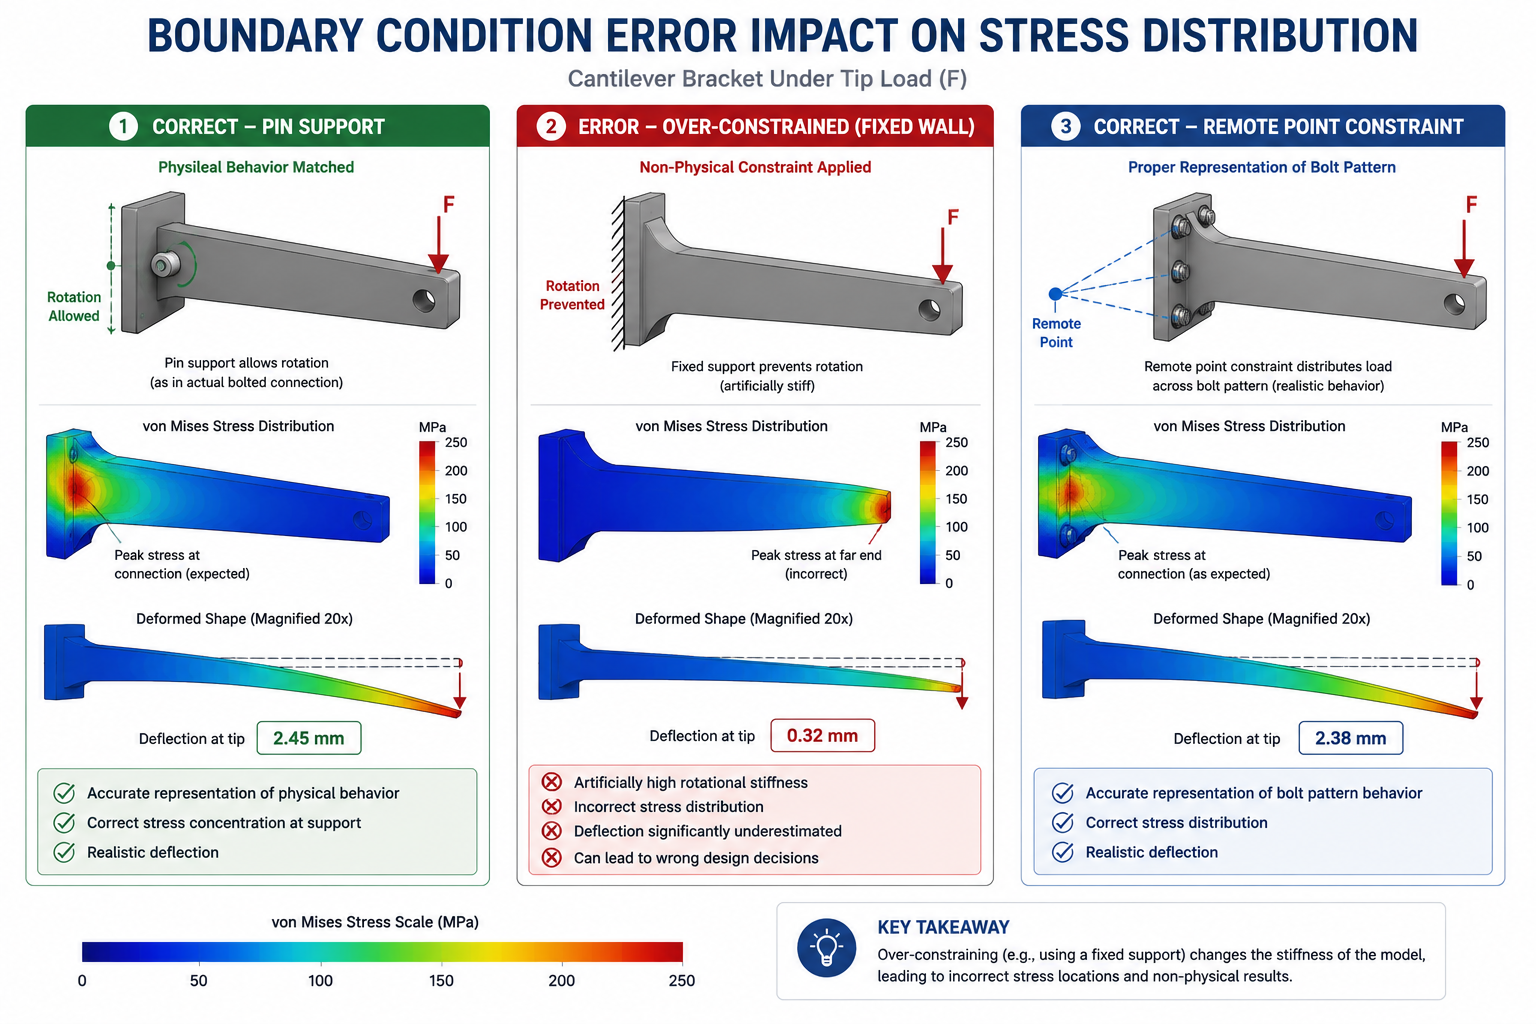
Boundary condition and load errors are addressed in the dedicated boundary conditions article, but their contribution to simulation failure deserves emphasis in the context of CAD-independent failures. A model with perfect CAD geometry, excellent mesh quality, and correct material properties can produce results that are wrong by a factor of 2 to 10 if the boundary conditions do not represent the physical support behavior
The most instructive example is the simply supported vs fixed-end beam. Both models have identical CAD geometry and material. The simply supported model (pin at one end, roller at the other) has a maximum bending moment at midspan of wL²/8 and zero moment at the supports. The fixed-fixed model has a maximum moment at the supports of wL²/12 and a midspan moment of wL²/24. For the same distributed load w and span L, the peak moment, and therefore the peak stress, differs by a factor of 3 between the two cases. Which result is correct depends entirely on how the physical supports behave, not on the CAD geometry of the beam.
The Over-Constraint Failure Mode
Over-constraint, applying more constraint than the physical support provides, is the boundary condition error that produces results that appear reasonable but are systematically wrong in a non-conservative direction. A fixed support at a bolted joint adds artificial bending resistance that the bolts do not provide. A fully tied contact at an interface that is actually bonded only in compression prevents the interface separation that would occur in the physical structure under peel loading.
The insidious feature of over-constraint errors is that the model produces lower stresses than the correctly constrained model, it appears to show a healthier safety factor. The fixed end of the over-constrained beam carries a bending moment that does not exist in the physical simply-supported beam, and this phantom moment reduces the midspan stress below the physically correct value. The analyst sees a ‘safe’ result and approves the design, while the physical structure, which does not have the phantom fixed-end moment, carries the full midspan moment that the over-constrained model suppressed.
Distributed vs Point Load Errors
The distribution of applied loads across a surface governs the local stress field near the load introduction zone. A point force applied to a single node produces a mathematically infinite stress at that node, a singularity with exactly the same character as the re-entrant corner singularity. The stress at the loaded node grows without bound as the mesh is refined, never converging to a physical value. This is not a mesh problem, it is a load modeling problem. The physical load is always distributed over a finite contact area, never concentrated at a mathematical point.
The fix is to apply the load over its actual physical contact area: a distributed pressure or traction over the bearing face, rather than a concentrated force at a node. For loads introduced through small contact areas (bolt heads, pin bearings, rivet heads), the contact area must be represented geometrically and the load distributed over that area. If the contact area geometry is too small to mesh explicitly, a remote force with an appropriate coupling constraint distributes the load over a representative surface while maintaining the correct resultant force and moment.
Category 4: Contact Modeling, The Nonlinear Physics That Linear Models Miss
Contact between surfaces is inherently nonlinear: surfaces either touch and transmit force, or they separate and transmit nothing. This binary on-off behavior cannot be represented by a linear model, and yet many structural FEA setups in industrial practice handle multi-component assemblies with either bonded contact (all surfaces permanently touching) or no contact at all (surfaces free to interpenetrate), both of which misrepresent the actual physics for any interface that may partially separate or slide under load.
Bonded Contact: When It’s Right and When It’s Dangerously Wrong
Bonded contact should only be used when surfaces are permanently joined (such as welded or adhesively bonded) and cannot separate or slide under load. If separation or sliding is possible, a contact model should be used instead. Modeling these interfaces as bonded can hide stress concentrations and produce inaccurate load paths, leading to non-conservative FEA results.
The consequence of using bonded contact at an interface that physically separates is that the model misses the peel stress concentration at the separation front, the stress intensity that drives delamination in composites, adhesive bond failure, and fatigue cracking at interference-fit edges. These are real failure modes in physical structures that the bonded contact model cannot predict regardless of how accurately the CAD geometry represents the interface.
Contact Pressure Distribution: Why Linear Models Get Hertzian Contact Wrong
When two curved surfaces contact under load (a ball bearing race, a cam follower, a gear tooth), the contact pressure distribution follows the Hertzian contact theory, a non-uniform pressure distribution across the contact ellipse that is highly concentrated at the center and drops to zero at the contact edge. This distribution can only be correctly predicted by a nonlinear contact model that allows the contact zone to grow as load increases and computes the pressure distribution from the actual surface deformation.
A linear elastic model with bonded contact over an assumed contact area produces a uniform pressure distribution that misrepresents the actual Hertzian distribution by a factor of up to 1.5 at the contact center and is wrong in both sign and magnitude at the contact edge. For applications where contact pressure drives fatigue (rolling contact fatigue in bearings, gear tooth fatigue, cam follower wear), a nonlinear contact analysis with realistic surface geometry and contact formulation is mandatory, the linear bonded contact result is not just inaccurate, it is qualitatively wrong in its prediction of the fatigue-critical stress distribution.
Category 5: Postprocessing Errors, Getting Wrong Answers from Correct Simulations
Postprocessing errors are the failure mode that the FEA preprocessing checklist and the physics assumption review cannot prevent, because they occur after the solver has produced correct results. The solver computes the correct stress tensor at every integration point for the given model setup. The error occurs when the analyst extracts, displays, or interprets those correct results in a way that misrepresents the physical stress state. A simulation that is set up correctly and solved correctly can still fail, by reporting the wrong number for the right location, or the right number for the wrong location, or a result that is correct for one physical interpretation but applied to a different one.
Error Type
What the Analyst Does
Why It’s Wrong
Correct Approach
Using averaged nodal stress instead of unaveraged at stress concentrations
Reports the smoothed, averaged stress contour value at the peak stress node
Averaging blends the peak node value with lower-stressed adjacent nodes, reducing the apparent peak by 10-40%, the true peak is in the unaveraged result
Always extract stress at stress concentration locations from unaveraged (element) results; use averaged results only for smooth stress regions
Using von Mises stress for fatigue analysis
Reports peak von Mises as the fatigue-driving stress
Von Mises is a scalar equivalent stress for yield prediction, it has no sign and cannot represent the tension-compression cycle that drives fatigue. Fatigue is driven by the maximum principal stress amplitude
Use signed maximum principal stress or critical plane methods for fatigue; von Mises for yield check only
Reporting stress at support nodes as peak stress
Identifies a high stress spike at a constrained node as the design-critical location
Point constraints create mathematical stress singularities that grow without bound as the mesh is refined, they do not converge to a physical value and are not representative of real stress
Exclude support nodes from peak stress evaluation; extract results at least one element size away from point constraints; distribute constraints over a surface
Ignoring stress singularities at re-entrant corners
Reports a very high stress at a sharp 90-degree internal corner as the critical stress
Stress at a perfectly sharp re-entrant corner is theoretically infinite in linear elastic FEA, it is a mathematical singularity caused by the corner geometry, not a physical failure prediction
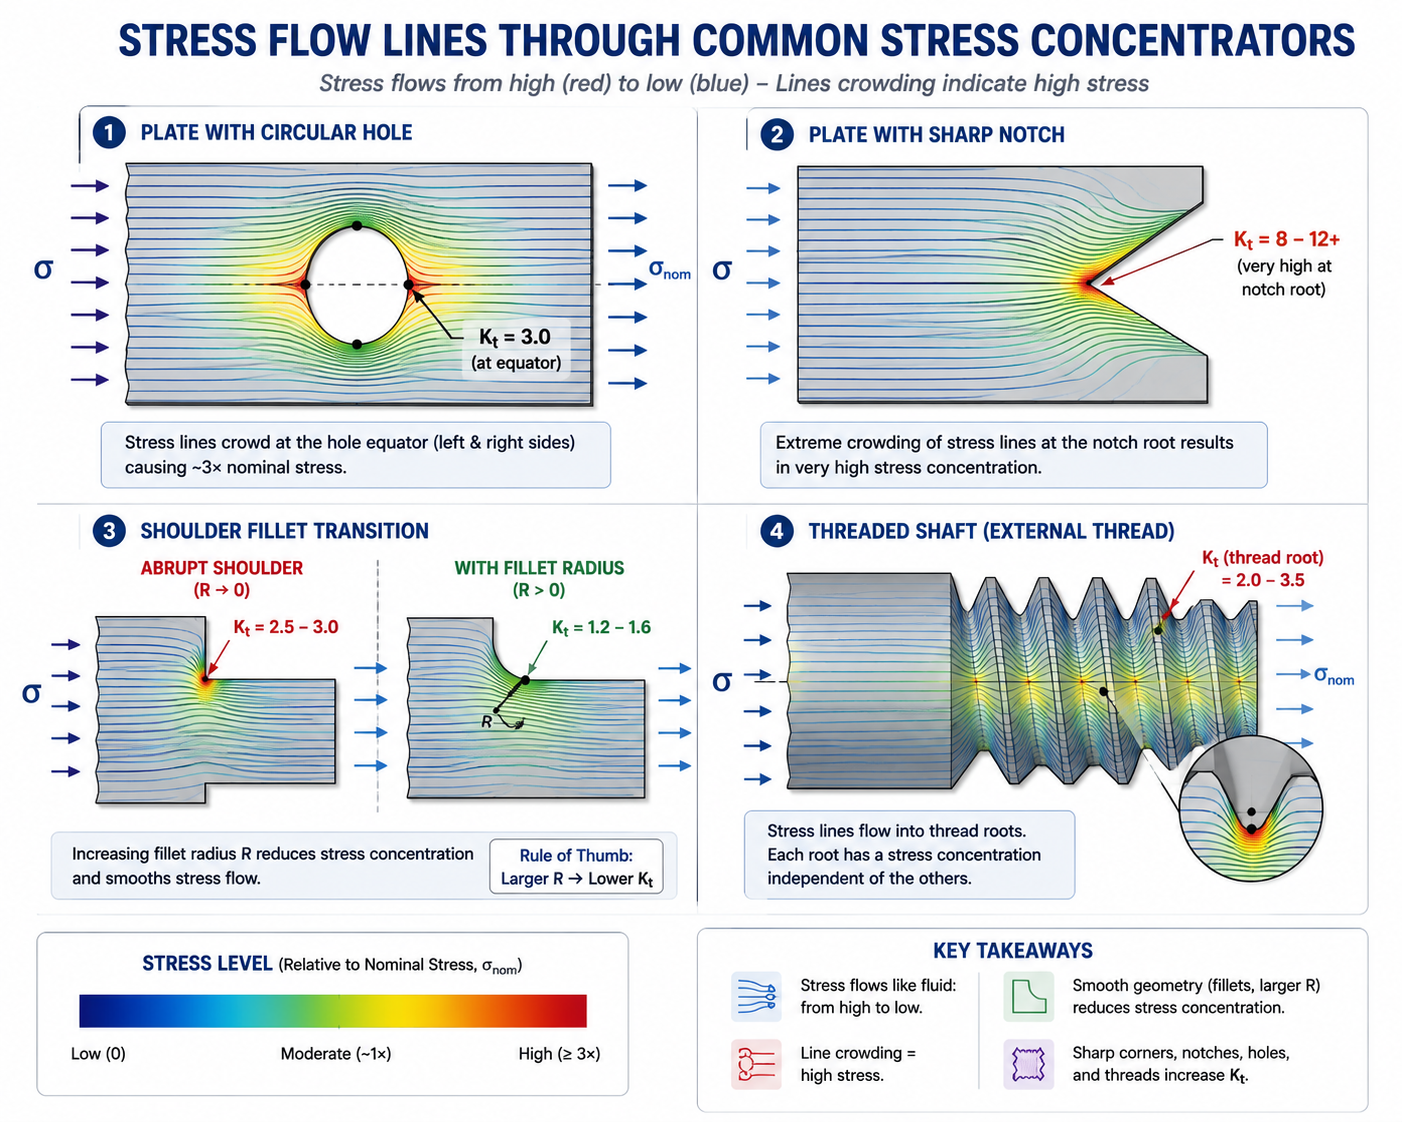
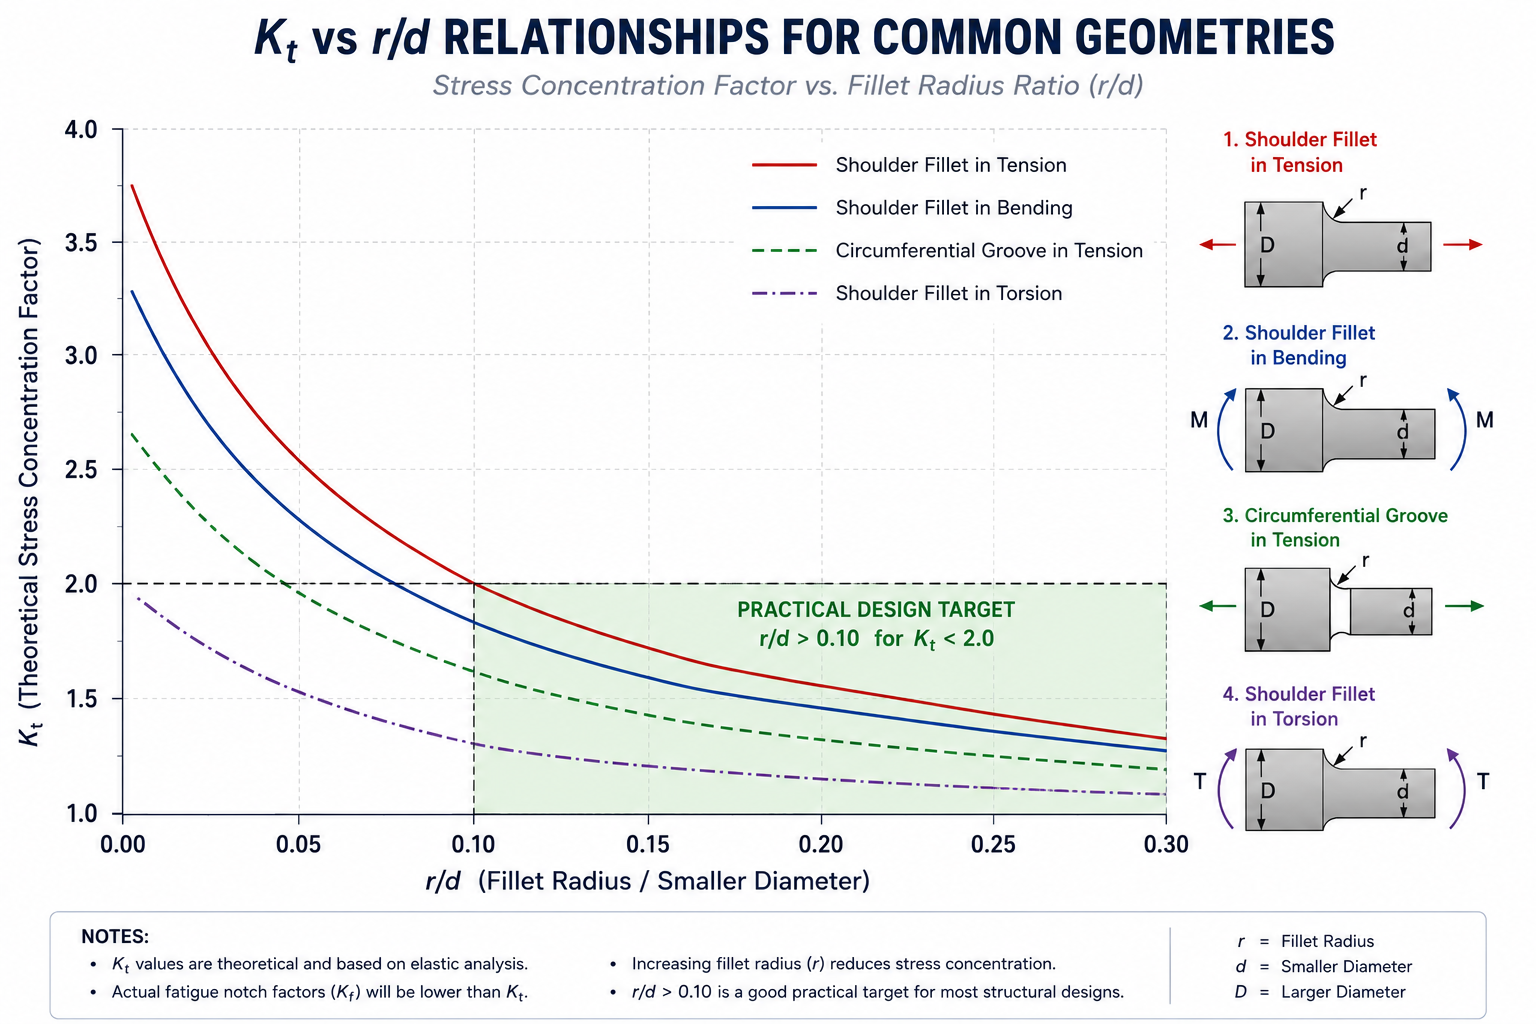
Add a realistic fillet radius at the corner; if the corner must be sharp in the design, use a conservative Kt factor from Peterson’s rather than the singularity value
Confusing local and global coordinate stress components
Reports sigma_x from global coordinate system at an inclined surface and compares to material strength in the thickness direction
Stress components are coordinate-system dependent, sigma_x in global coordinates is not the same as the normal stress perpendicular to an inclined surface
Transform stress to the local material coordinate system at the critical surface; use principal stresses for coordinate-independent comparison to material limits
Selecting the wrong stress measure for the material failure criterion
Uses von Mises stress to check a brittle ceramic or cast iron component
Von Mises (distortion energy) criterion is appropriate for ductile metals. Brittle materials fail in tension, the maximum principal stress (Rankine) criterion is correct
Match the failure criterion to the material: von Mises for ductile metals; maximum principal stress for ceramics, glass, and gray cast iron; Tsai-Wu or Hashin for composites
Reporting maximum stress across entire model without checking location
States ‘maximum stress is 450 MPa’ without reporting where it occurs
The maximum stress location determines whether it represents a real failure risk or a modeling artifact (singularity at a constraint, mesh-dependent peak at a sharp corner)
Always report stress with location: ‘Maximum stress is 450 MPa at the shoulder fillet, r=2mm, confirmed converged with mesh study’
Missing fatigue mean stress correction
Applies Basquin S-N curve directly to stress amplitude without considering mean stress
S-N curves are typically generated at zero mean stress (fully reversed, R=-1). Non-zero mean stress reduces fatigue life, the Goodman or Morrow correction must be applied when mean stress is non-zero
Apply Goodman or Morrow mean stress correction: (sigma_a/Se) + (sigma_m/Su) = 1/SF for Goodman
The Averaged vs Unaveraged Stress Decision
Every FEA postprocessor offers the choice of displaying stress as averaged nodal stress or unaveraged (element) stress. The difference is significant at stress concentration locations and is the source of one of the most systematic result under-predictions in structural FEA practice.
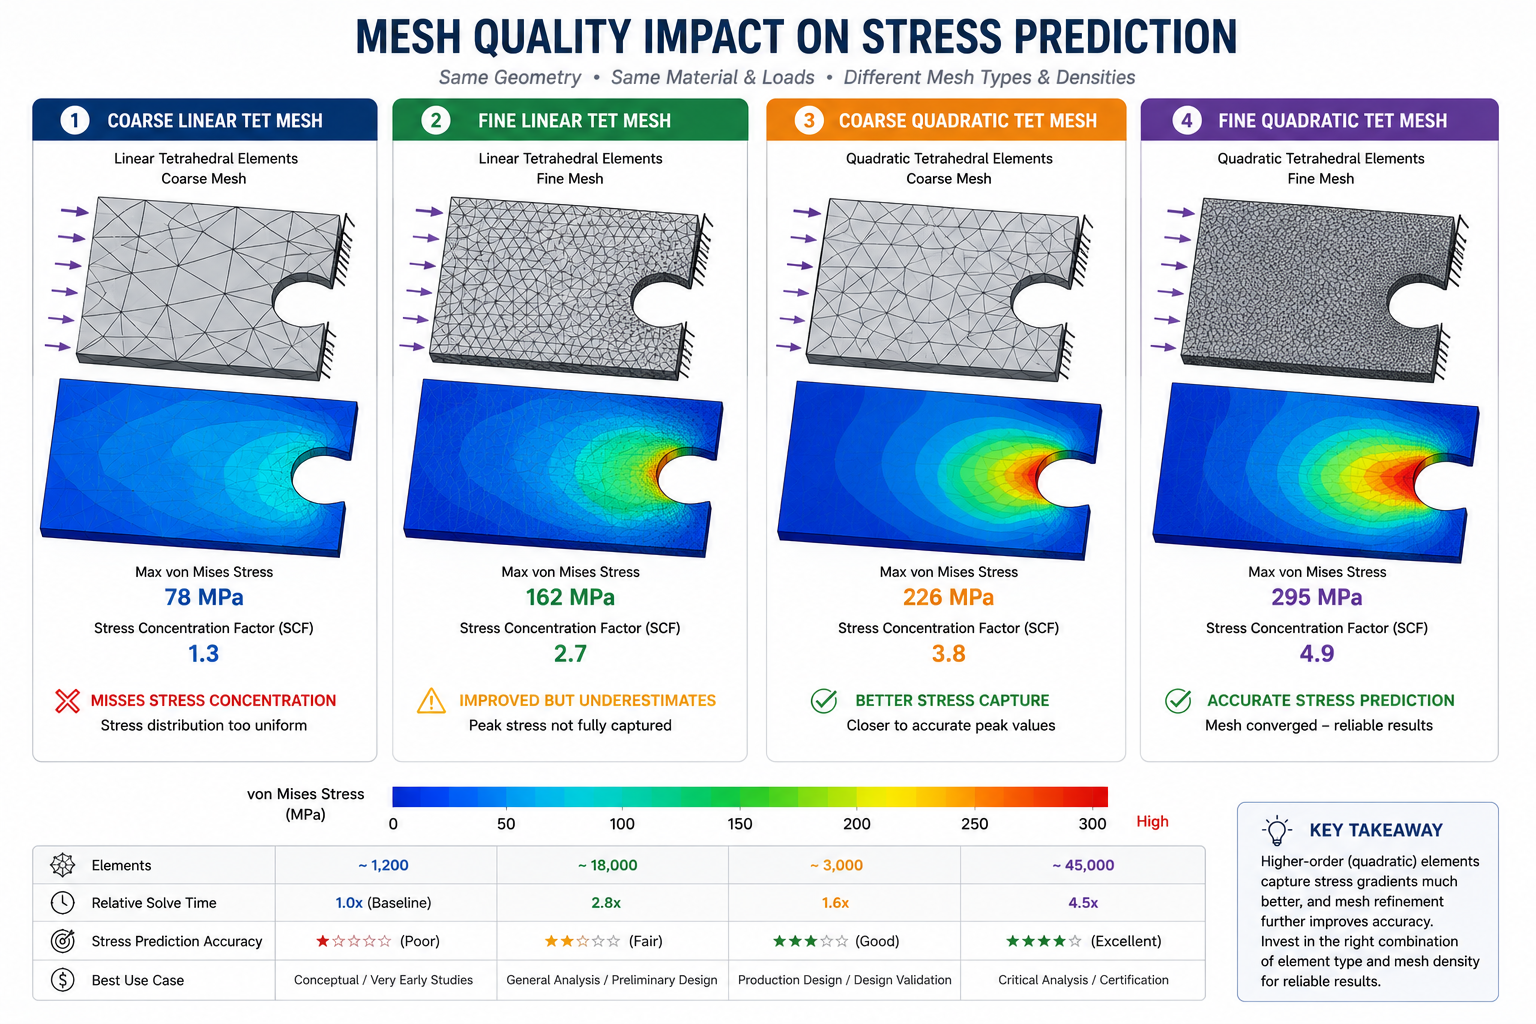
Averaged nodal stress is computed by averaging the stress values from all elements sharing each node. This averaging smooths the stress field and produces visually cleaner contour plots. At stress concentration locations, where the stress gradient is steep, the peak element has a higher stress than the surrounding elements. The averaging operation blends the peak element’s stress with its lower-stressed neighbors, reducing the displayed peak stress by 10 to 40 percent compared to the true unaveraged value
Unaveraged stress displays the stress for each element from its own integration point extrapolation, without blending with adjacent elements. At a well-meshed stress concentration with sufficient element density, the maximum unaveraged stress converges to the true stress concentration value as the mesh is refined. For all stress extraction at stress concentrations and failure-critical locations, unaveraged element stress is the correct quantity to report. Averaged stress is appropriate for smooth stress field regions where the gradient is small, and for comparing results across a large model at a global level, never for peak stress quantification at a notch, fillet, or hole.
The Stress Singularity Identification Protocol
A stress singularity in FEA is a location where the computed stress grows without bound as the mesh is refined, a sign that the mathematical model has a point of theoretically infinite stress that has no physical counterpart. Not every high-stress node in an FEA model represents a real structural risk, many are singularities caused by modeling choices that must be identified and excluded from design evaluation.
The three most common sources of stress singularities are:
Sharp re-entrant corners: A 90-degree internal corner in a solid model has theoretically infinite stress in linear elastic FEA. The singularity arises from the corner geometry, not from a physical stress concentration in the real part (which always has a finite radius). Resolution: add the actual corner radius to the model. If the physical corner is truly sharp (ground to a sharp edge), use a stress concentration factor from Peterson’s rather than the FEA singularity value.
Point constraints: A fixed BC applied to a single node concentrates the reaction force at a mathematical point, producing a stress singularity with exactly the same character as the corner singularity. Resolution: apply BCs over a surface, not a single node; or extract stress results at a distance of at least one element size from the constrained node, where Saint-Venant’s principle ensures the singularity has decayed.
Point loads: A concentrated force at a single node produces a stress singularity at that node. Resolution: distribute the load over the actual contact surface, or use a remote force with a coupling constraint to a representative load introduction area.
The diagnostic test for a stress singularity: refine the mesh at the suspect location and observe whether the peak stress increases. If the peak stress increases with mesh refinement and shows no sign of converging, it is a singularity. A genuine physical stress concentration converges, the peak stress approaches a finite value as the mesh density increases. A singularity diverges. This distinction is fundamental to correct results interpretation and must be made before reporting any very high stress value from an FEA model.
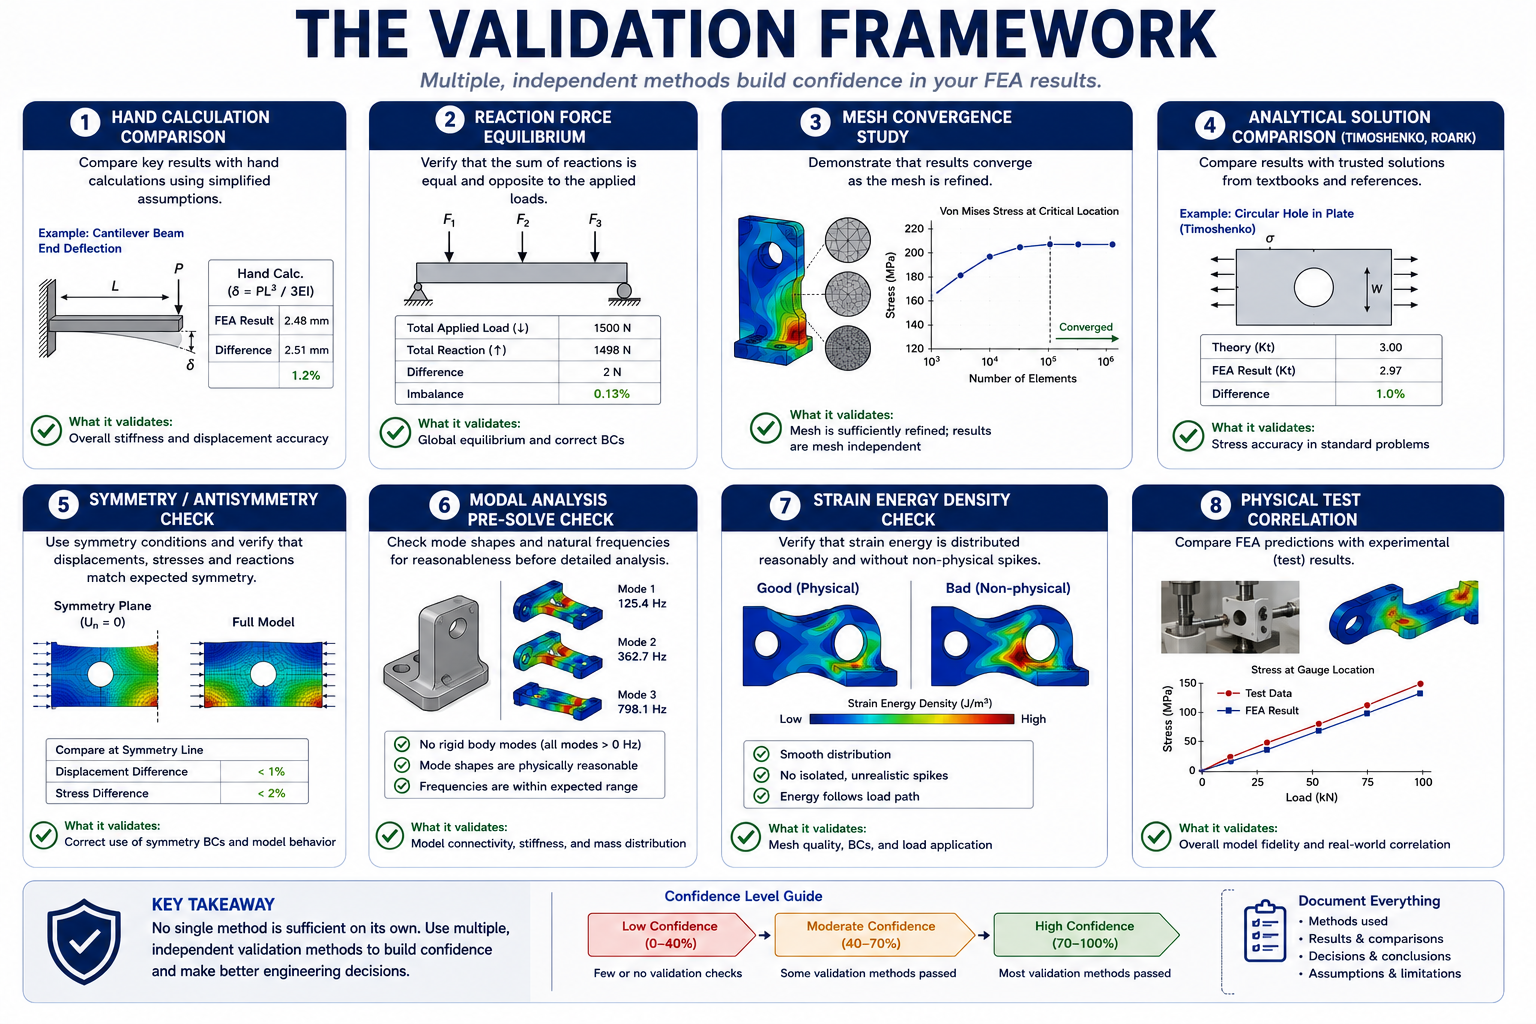
The Validation Framework: Catching Failures Before They Reach Design Decisions
FEA validation is the systematic process of confirming that a simulation result correctly represents the physical behavior of the structure. Validation is not a single check, it is a layered framework of independent verification methods, each of which catches a different class of failure. No single validation method catches all failure modes. A reaction force check does not catch a material model error. A mesh convergence study does not catch a physics assumption error. A hand calculation comparison does not catch a postprocessing interpretation error. All must be applied.
Validation Method
What It Checks
When to Use
Pass Criterion
Hand calculation comparison
Order-of-magnitude correctness of displacement and stress; basic load path logic
Always, every analysis, every load case
FEA result within 20-30% of simplified hand calc; differences explained by geometry complexity, not errors
Reaction force equilibrium
Applied loads are correctly transmitted through the model; no load is lost or multiplied at interfaces
Every static analysis as a mandatory post-solve check
Sum of all reaction forces equals sum of all applied forces in each global direction, within 0.1% tolerance
Mesh convergence study
Peak stress at critical locations is mesh-independent (converged)
Every analysis where peak stress at a stress concentration governs the design
Peak stress changes < 2% between medium and fine mesh refinements
Known closed-form solutions for beams, plates, cylinders, pressure vessels, confirms physics is correctly modeled
Whenever geometry can be approximated by a standard geometry with known solution
FEA result within 5% of analytical solution for the simplified geometry
Symmetry / antisymmetry check
Model physics is internally consistent, symmetric loads produce symmetric results, antisymmetric loads produce antisymmetric results
Any model with geometric symmetry, apply symmetric load, verify symmetric response; apply antisymmetric load, verify antisymmetric response
Stress and displacement fields mirror correctly across the symmetry plane
Modal analysis pre-solve check
Boundary conditions correctly remove all 6 rigid-body modes; model is properly constrained
Before every static, dynamic, or nonlinear analysis
Zero near-zero-frequency modes (all modes above 1 Hz for structural model)
Strain energy density check
Elements with very high strain energy density relative to neighbors may indicate mesh problems or singularities
When stress contours show isolated high-stress nodes or elements not consistent with the loading
Strain energy density should vary smoothly across the model; isolated peaks indicate mesh or BC errors
Physical test correlation
Complete model (physics, geometry, BCs, materials, loads) predicts measured physical test results
Whenever physical test data is available, required for model validation before results are used for design decisions
FEA prediction within 10-15% of measured strain gauge readings or 5% of measured natural frequencies at validated locations
The Hand Calculation as the First Line of Defense
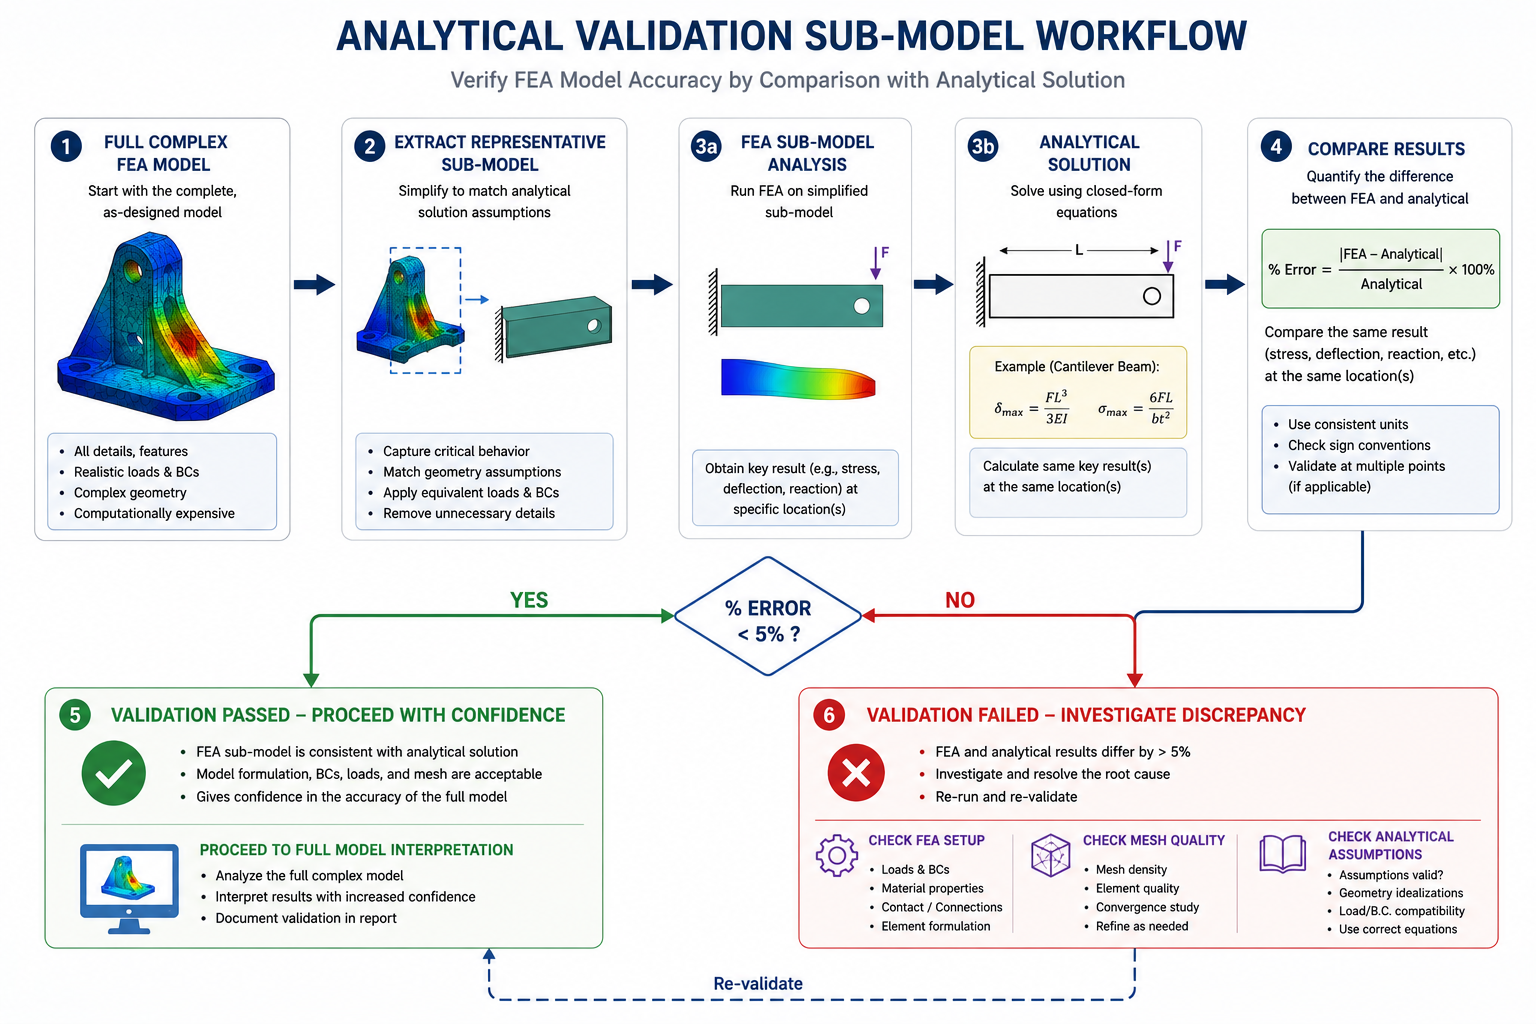
The most powerful and most underused validation tool in FEA practice is the hand calculation comparison, computing an approximate expected result using beam theory, plate theory, thin-wall pressure vessel formulas, or other closed-form methods before examining the FEA output. The hand calculation does not need to be exact: it needs to give the right order of magnitude and the right physical trend (which end deflects more, which face is in tension, where the bending moment peaks).
Before reviewing FEA results, estimate the expected stress and displacement using hand calculations. If the FEA results are within 20–30% of the estimate, the model is likely behaving correctly. Differences greater than 50% should be investigated, as they may indicate an error in the model, assumptions, or calculations that must be explained before the results are trusted.
Physical Test Correlation: The Ultimate Validation
Physical test correlation, comparing FEA predictions against measured strain gauge readings, displacement measurements, or natural frequencies from a physical prototype, is the most definitive form of simulation validation. A model that has been correlated against physical test data at multiple locations and load levels is validated; a model that has only been verified for internal consistency (reaction equilibrium, mesh convergence) is verified but not validated. The distinction matters for the confidence that can be placed in extrapolated predictions, load cases or geometric variants not covered by the physical test.
The correlation criterion: FEA predictions should agree with measured strain gauge readings within 10 to 15 percent at validated locations, and modal frequencies should agree within 5 percent for correlated natural frequencies. Discrepancies outside these ranges indicate model errors that must be identified and corrected before the model is used for design predictions. Acceptable correlation at one location does not validate the model at all locations, correlation must cover the range of stress states, boundary conditions, and geometric features that the model will be used to analyze.
The Plausibility Trap: Why Wrong Results Look Right
The defining feature of the simulation failures described in this article is that wrong results are usually plausible. The stress contours are smooth and visually credible. The deformation shape makes intuitive sense. The peak stress value is in a reasonable range, not implausibly high and not suspiciously zero. The solver completed without errors. There is nothing in the output that signals a problem to an analyst who is not specifically looking for the error class that caused it.
This plausibility is the reason systematic validation is necessary. An analyst who only reviews FEA output for plausibility, does the result look reasonable?, will miss every error that produces a plausible wrong result. This includes the physics assumption errors (linear elastic analysis of yielding material gives plausible stress distributions, just at wrong magnitudes), the boundary condition errors (fixed vs pinned gives plausible stress distributions with different values), the postprocessing errors (averaged stress at a notch gives a plausible smooth contour, just lower than the true peak), and the material model errors (wrong material data gives plausible-looking results with wrong magnitudes).
The Confirmation Bias Problem in FEA Review
FEA review is susceptible to confirmation bias in a specific and dangerous way: when the result confirms the analyst’s engineering intuition about where the highest stress should be and approximately what magnitude it should be, the review tends to stop. The result ‘makes sense,’ so it is accepted. But engineering intuition about stress magnitude is much less reliable than intuition about stress location.
An experienced engineer typically knows which feature is most highly stressed in a structure, a shoulder fillet, a bolt hole, a section transition. What engineering intuition cannot reliably predict is whether the peak stress at that feature is 185 MPa or 312 MPa, or whether it is driving a fatigue failure through von Mises or through maximum principal stress amplitude.
The protection against confirmation bias in FEA review is quantitative validation against an independent reference, not a subjective assessment of whether the result looks right. The independent reference can be a hand calculation, an analytical solution from Roark’s Formulas or Peterson’s Stress Concentration Factors, a comparison against a different FEA model with different element types or boundary condition assumptions, or a physical strain gauge measurement. Any of these provides the quantitative check that qualitative plausibility review cannot.
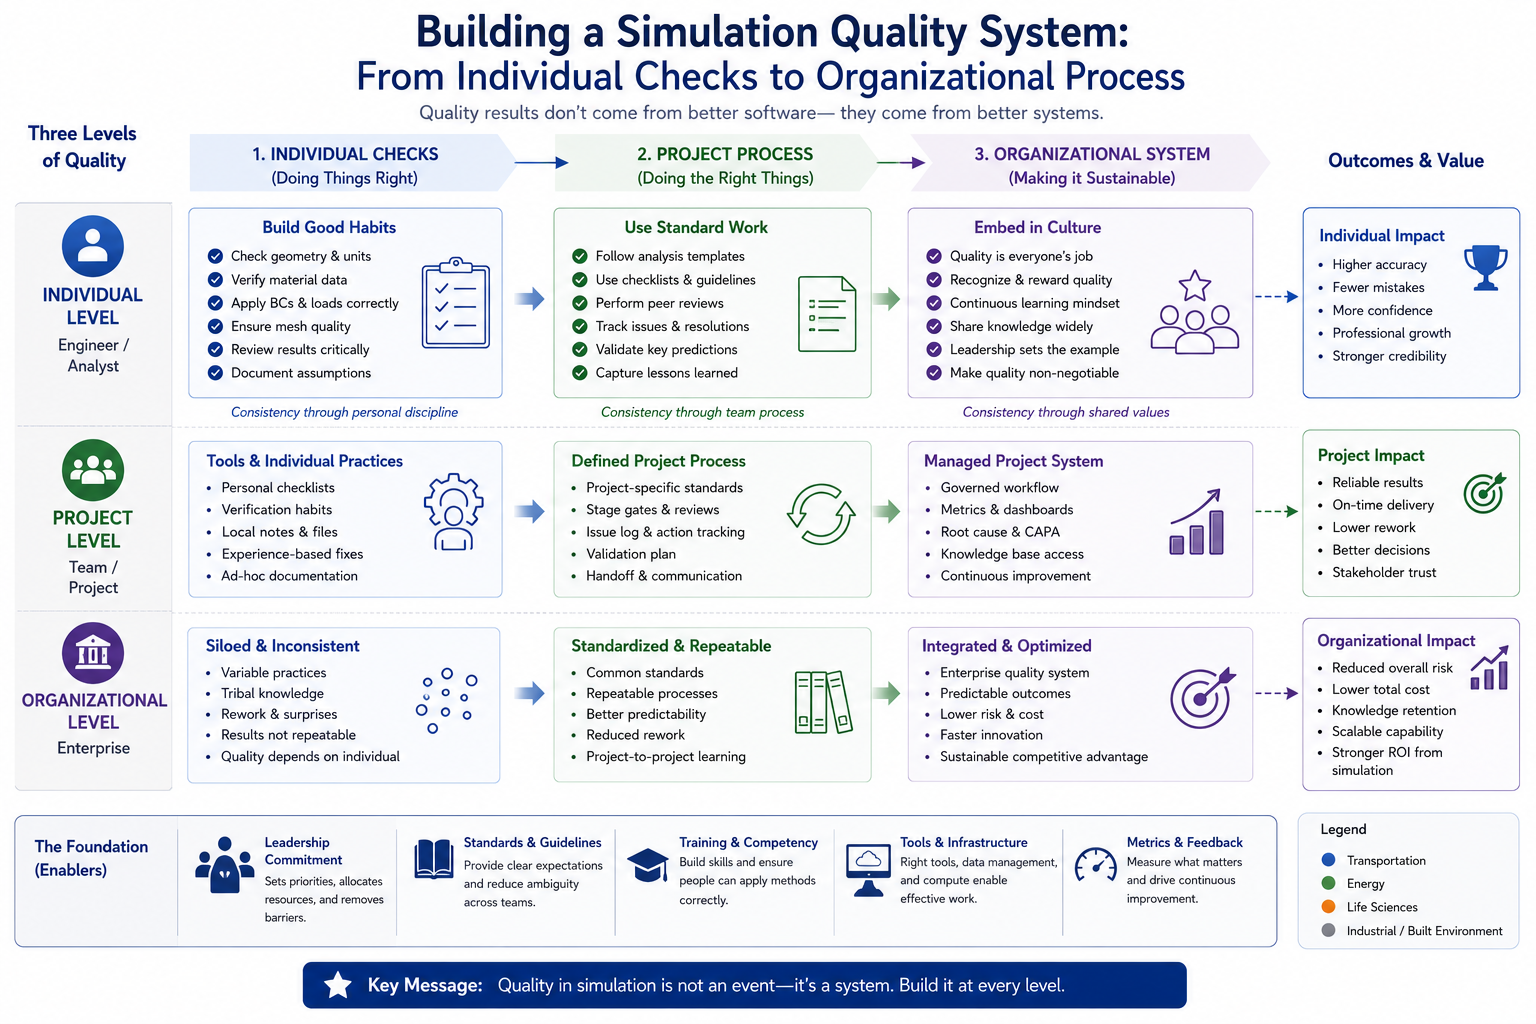
Building a Simulation Quality System: From Individual Checks to Organizational Process
Individual analysts applying the validation methods described in this article can catch a large fraction of simulation failures. But the most effective protection against simulation failure is an organizational simulation quality system, a structured process that makes validation mandatory, creates independent review, and builds a institutional memory of the failure modes specific to the organization’s product types and analysis methods.
The Four Elements of a Simulation Quality System
Analysis plan documentation: Before model building begins, document the analysis objective, the physics assumptions, the accepted simplifications and their justification, the load cases, the acceptance criteria, and the validation plan. An analysis plan that is reviewed before the model is built catches physics assumption errors at the lowest-cost stage, when changing the approach costs hours rather than days.
Preprocessing checklist enforcement: The 30-point checklist from the preprocessing article in this series should be a required deliverable for every analysis, completed and signed by the analyst and reviewed by a peer. Checklist enforcement is the most efficient way to catch the preprocessing error categories: unit system inconsistency, wrong element type, missing mesh convergence studies, and boundary condition errors.
Independent technical review: Every analysis that will be used to make a design decision or support a regulatory submission should be reviewed by an engineer who did not build the model. Independent reviewers catch assumptions that the original analyst has normalized, the BC that has always been applied this way, the material value that came from an unverified spreadsheet, the stress measure that was used in the last ten analyses without questioning its appropriateness. Peer review is the validation method with the highest return on time invested.
Lessons-learned database: Every simulation failure that is caught, whether in internal review or by comparison with physical test data, should be documented in a format that makes it accessible to other analysts. The failure mode, the analysis type, the error category, and the detection method should all be recorded. Over time, this database becomes the organization’s institutional knowledge of which errors occur most frequently in which analysis types for which product categories, the most valuable guide to where scrutiny should be applied in future analyses.
Frequently Asked Questions
Q: If the CAD model is good and the mesh quality is good, why do FEA results fail?
FEA results can still fail because the biggest errors usually come from incorrect engineering assumptions, not the CAD model or mesh. Wrong boundary conditions, material properties, load definitions, physics selection, or failure criteria can produce inaccurate results even with a perfectly meshed model. Verification and validation are essential to detect these analyst-driven errors.
Q: What is the difference between von Mises stress and maximum principal stress, and when should I use each?
Use von Mises stress to evaluate yielding in ductile metals because it predicts permanent deformation. Use maximum principal stress for brittle materials, fatigue analysis, and fracture mechanics, where tensile stresses control failure. Choosing the wrong stress criterion can lead to incorrect safety assessments and unreliable FEA results.
Q: How do I know if a high-stress result is a real failure risk or a mesh singularity?
Refine the mesh around the high-stress region and compare the results. If the stress converges with mesh refinement, it represents a real stress concentration. If the stress keeps increasing without convergence, it is likely a mesh singularity caused by sharp corners, point loads, or idealized constraints rather than a physical failure.
Q: What is the most important validation check after running an FEA analysis?
The most important post-processing check is reaction force equilibrium. In a correct static analysis, the total reaction forces and moments should match the applied loads within an acceptable tolerance. If they do not, the model likely contains errors in boundary conditions, contacts, or load application.
Q: Can a simulation be verified but not validated, and what is the practical difference?
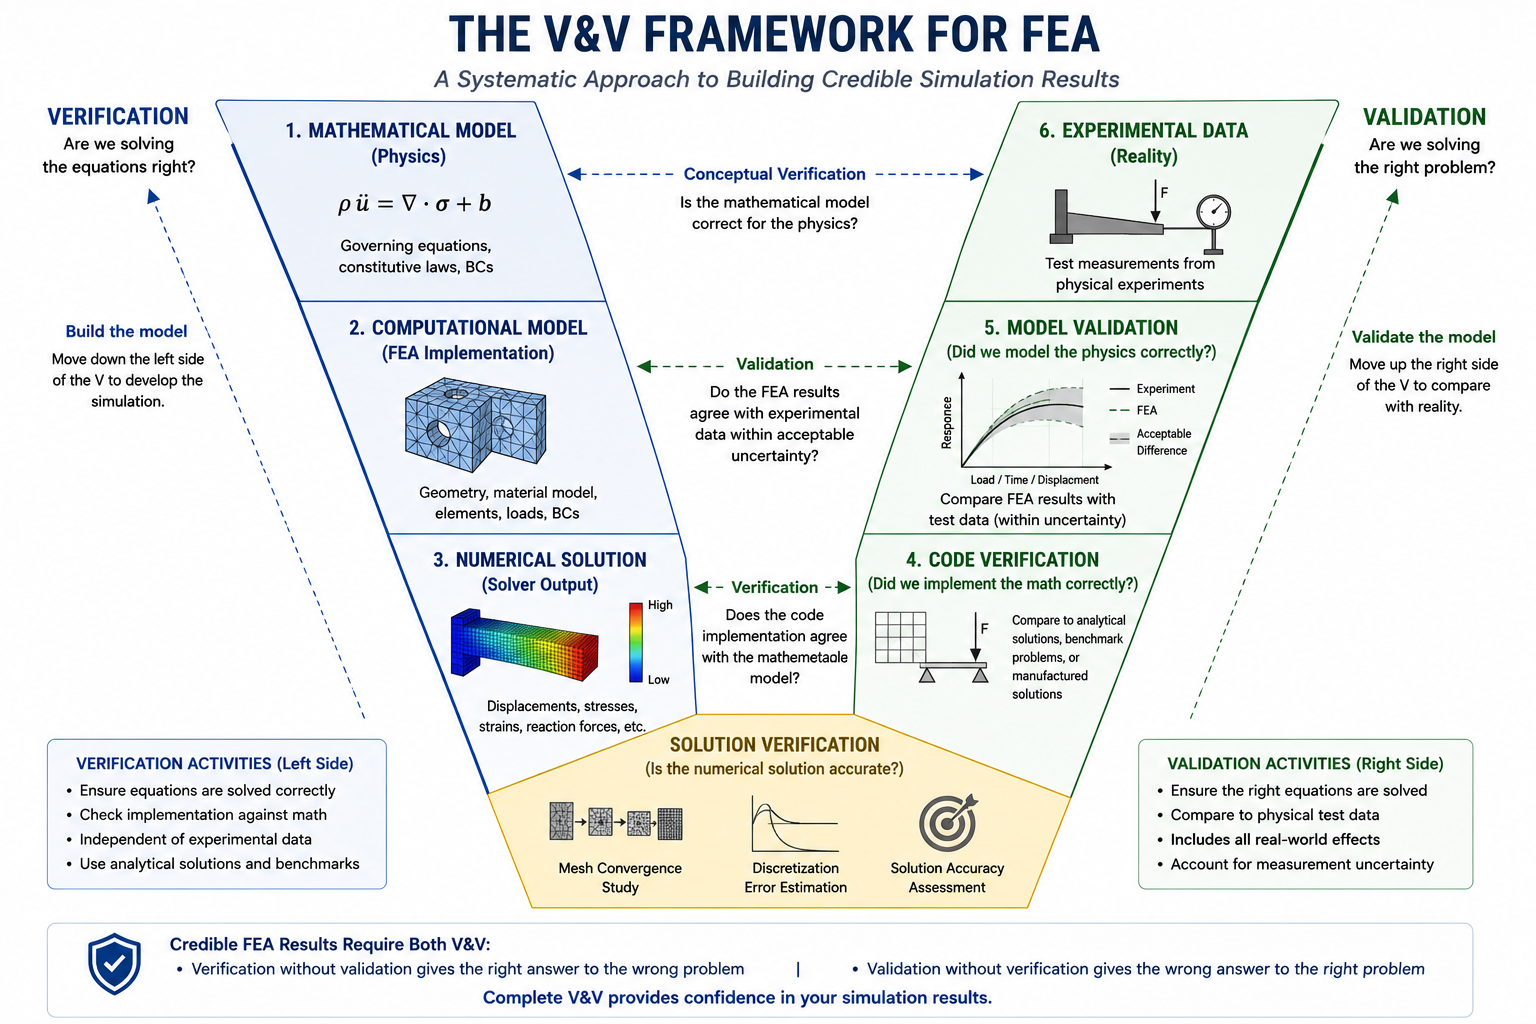
Yes. Verification confirms that the mathematical model has been solved correctly, while validation confirms that the model accurately represents the real physical system. A simulation can be numerically correct but still produce misleading results if the underlying assumptions, materials, or boundary conditions do not reflect reality.
Q: What is the most dangerous simulation failure mode, the one most likely to cause a real-world product failure?
The most dangerous failure mode is a non-conservative simulation, where the model predicts a design is safe when it is not. This often results from incorrect boundary conditions, inappropriate physics assumptions, or using the wrong failure criterion, leading to unsafe engineering decisions despite apparently acceptable FEA results.
Conclusion:
The message of this article can be stated directly: simulation fails because of decisions the analyst makes, not because of the quality of the CAD model. CAD geometry is the starting point for FEA, but it is not the determinant of FEA accuracy. The determinant is the quality of the judgments made at every step from physics selection to results interpretation, judgments that the software cannot make, the mesh cannot correct, and the solver cannot verify.
The twelve failure categories in this article, from wrong physics assumptions through postprocessing interpretation errors, share a common feature: they are all analyst decisions. They are decisions about which equations to solve, which material behavior to assume, how to represent supports and loads, and how to read the output. Improving these decisions requires not better software or better CAD, but better physics understanding, more rigorous validation habits, and organizational processes that make systematic review the default rather than the exception.
The practical implication for any engineering organization that uses FEA: the return on investment from analyst training and validation process improvement exceeds the return from higher-end simulation software, better hardware, or higher-quality CAD tools, because the errors that training and process improvement address are the dominant sources of wrong results. A well-trained analyst with rigorous validation habits using mid-tier software produces more reliable results than an untrained analyst with premium tools and perfect CAD. The tools serve the judgment. The judgment is what determines whether the simulation is worth trusting.
Strengthen your simulation practice with our guides on FEA preprocessing, boundary condition selection, static vs dynamic analysis, stress concentration, mesh quality, and the top industries where simulation accuracy determines product success.
The analysis had taken fourteen hours to run on the HPC cluster. The stress contours looked reasonable at first glance, the colors were plausible, the deformation shape made sense, and the peak stress value was within the expected range. But when the engineer tried to verify the result against a hand calculation for a simplified version of the geometry, the numbers didn’t match. After two hours of investigation, the problem surfaced: the material density had been entered as 7850 kg/m³ in a model where the geometry was defined in millimeters.
The mass matrix was wrong by a factor of 10⁹. The natural frequencies from the modal analysis were off by a factor of 31,623. Every dynamic result in the analysis was meaningless.
Unit mismatches are one of the most common FEA preprocessing errors, and one of the least obvious, because the stress results from a static analysis are often unaffected by density errors and look completely normal. The error only manifests in dynamic results, and only if the analyst checks them against an independent reference. Without the hand calculation cross-check, the wrong results would have been reported as correct. This is the defining characteristic of preprocessing errors: they do not produce error messages. The solver runs, the results appear, and the output looks like a valid FEA result. The only thing that reveals the error is a systematic check of every preprocessing decision, which is exactly what a preprocessing checklist provides.
This article presents a 30-point FEA preprocessing checklist covering the six categories where preprocessing errors most commonly occur: analysis scoping, geometry preparation, material assignment, element selection, mesh quality, boundary conditions and loads, and analysis settings. Each checklist item identifies the failure mode it prevents, its priority, and what to do when the check fails. The article also includes four reference tables: geometry cleanup decisions, element type selection, mesh quality metrics with acceptable ranges, and unit system compatibility. Used before every analysis run, this checklist catches the errors that fourteen-hour solver runs cannot.
The 30-Point FEA Preprocessing Checklist
The following checklist covers every preprocessing decision category. Items marked Critical will produce wrong results or solver failure if skipped. Items marked High introduce significant accuracy risk. Items marked Medium are good practice that prevents post-processing problems. Work through the checklist in order, the categories are sequenced so that early errors are caught before time is invested in later steps that depend on them.
#
Checklist Item
Category
Failure Mode if Skipped
Priority
1
Confirm analysis objective and required output quantities
Scoping
Wrong element type, mesh density, or analysis type selected for the question being asked
Critical
2
Identify all load cases and combinations
Scoping
Critical load combinations missed; non-governing cases consume compute time
Critical
3
Define required accuracy and acceptable error tolerance
Scoping
Over-meshing (wasted time) or under-meshing (wrong results) with no basis for judgment
Critical
4
Simplify CAD geometry, remove non-structural features
Geometry
Mesh generation fails or produces poor-quality elements at fillets, logos, and cosmetic features
Critical
5
Verify geometry units and scale
Geometry
Stress results in wrong units by 3 to 6 orders of magnitude; deformation looks wrong but error is not obvious
Critical
6
Check for geometry gaps, overlaps, and duplicate surfaces
Geometry
Mesh generation creates unconnected regions or double elements; load transfer fails silently
Critical
7
Confirm midsurface extraction for thin-walled parts (shell models)
Geometry
Shell model offset by half-thickness; contact and load application on wrong face
High
8
Assign correct material properties, E, nu, density, yield stress
Materials
All stress results wrong by the ratio of correct to incorrect modulus
Critical
9
Verify material property units match model units
Materials
Same as above, unit mismatch produces results that are plausible but wrong
Critical
10
Confirm material direction for orthotropic / anisotropic materials
Materials
Composite or wood material loaded in wrong principal direction; stiffness 5-50x wrong
Critical
11
Select correct element type for the physics
Elements
Shell elements for thick sections (t/L > 0.1) give wrong results; solid elements for thin shells miss bending
Critical
12
Use quadratic elements where stress gradients are important
Elements
Linear elements underestimate peak stress at notches and fillets by 20-50%
High
13
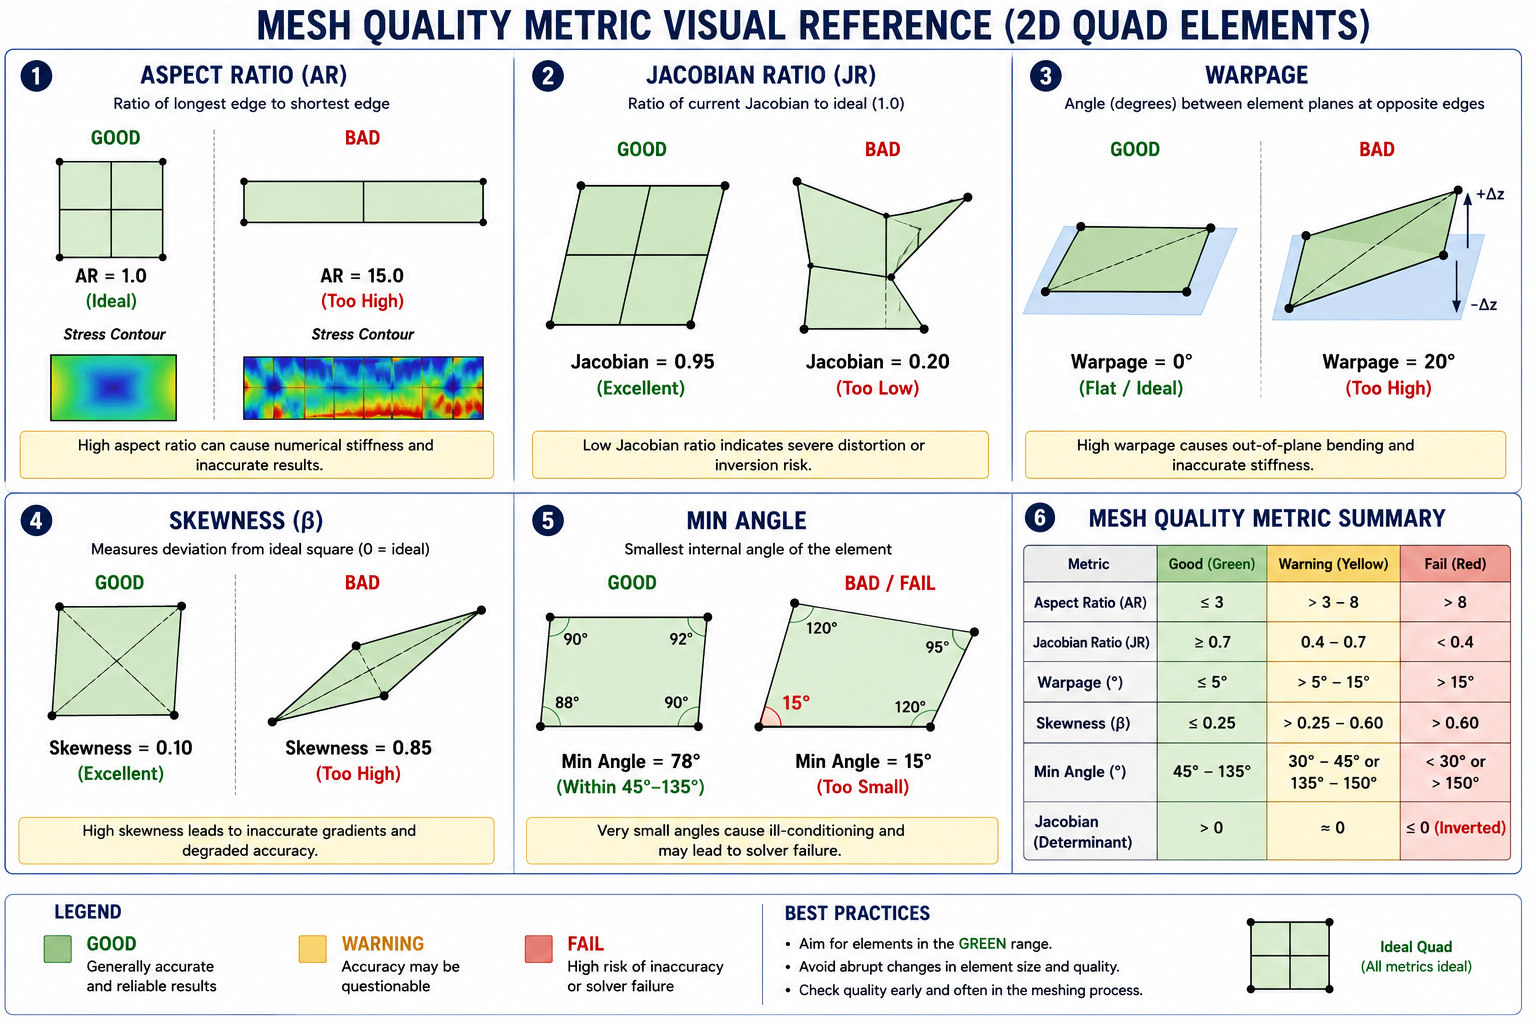
Check element aspect ratio, target < 5:1, never exceed 10:1
Mesh Quality
High-aspect elements produce large discretization errors and ill-conditioned stiffness matrix
Critical
14
Check Jacobian ratio, all elements above 0.6
Mesh Quality
Negative Jacobian elements cause solver failure; low Jacobian degrades accuracy
Critical
15
Verify element warpage angle < 10 degrees for quads and hexahedra
Mesh Quality
Warped elements introduce mapping errors that degrade stress accuracy
High
16
Confirm mesh density at stress concentrations (8+ elements per radius)
Mesh Quality
Peak stress at notches, holes, and fillets under-predicted; safety factors non-conservative
Critical
17
Run mesh convergence study at critical locations
Mesh Quality
Results are mesh-dependent; no basis for trusting the stress answer
Critical
18
Verify node connectivity at interfaces, no gaps between parts
Mesh Quality
Load transfer fails between components; artificial stress concentration at interface
Critical
19
Apply correct boundary conditions, constrain exactly the physical DOFs
Eliminate all rigid-body modes, run modal pre-check
Boundary Conditions
Singular stiffness matrix; solver fails or returns meaningless large displacements
Critical
21
Apply symmetry BCs correctly, verify DOF assignments for symmetry vs antisymmetry
Boundary Conditions
Antisymmetric load on symmetric BC gives completely wrong stress distribution
High
22
Define contact pairs with correct formulation and friction
Boundary Conditions
Contact interpenetration or artificial separation; load path incorrect through contact
High
23
Apply loads in correct direction, magnitude, and distribution
Loads
Stress result wrong by up to 100% if load direction or distribution is incorrect
Critical
24
Verify load units match model units
Loads
Loads off by 3-6 orders of magnitude; results look wrong but error source is not obvious
Critical
25
Check gravity direction and magnitude if self-weight is included
Loads
Self-weight applied in wrong direction; upward gravity produces tension in horizontal members
High
26
Confirm pressure load sign convention, inward vs outward positive
Loads
Pressure vessel analyzed in tension instead of compression or vice versa
High
27
Verify load application point matches physical load introduction
Loads
Stress concentration artifact at load application node; Saint-Venant region pollutes result
High
28
Confirm analysis type matches load character, static vs dynamic
Analysis Settings
Static analysis misses resonance amplification; DAF up to 50x at resonance
Critical
29
Set nonlinear analysis controls, convergence criteria and step size
Analysis Settings
Nonlinear analysis diverges or gives false convergence at wrong equilibrium state
High
30
Request correct output quantities, reactions, stress invariants, energy
Analysis Settings
Critical output not available post-solve; rerun required
Medium
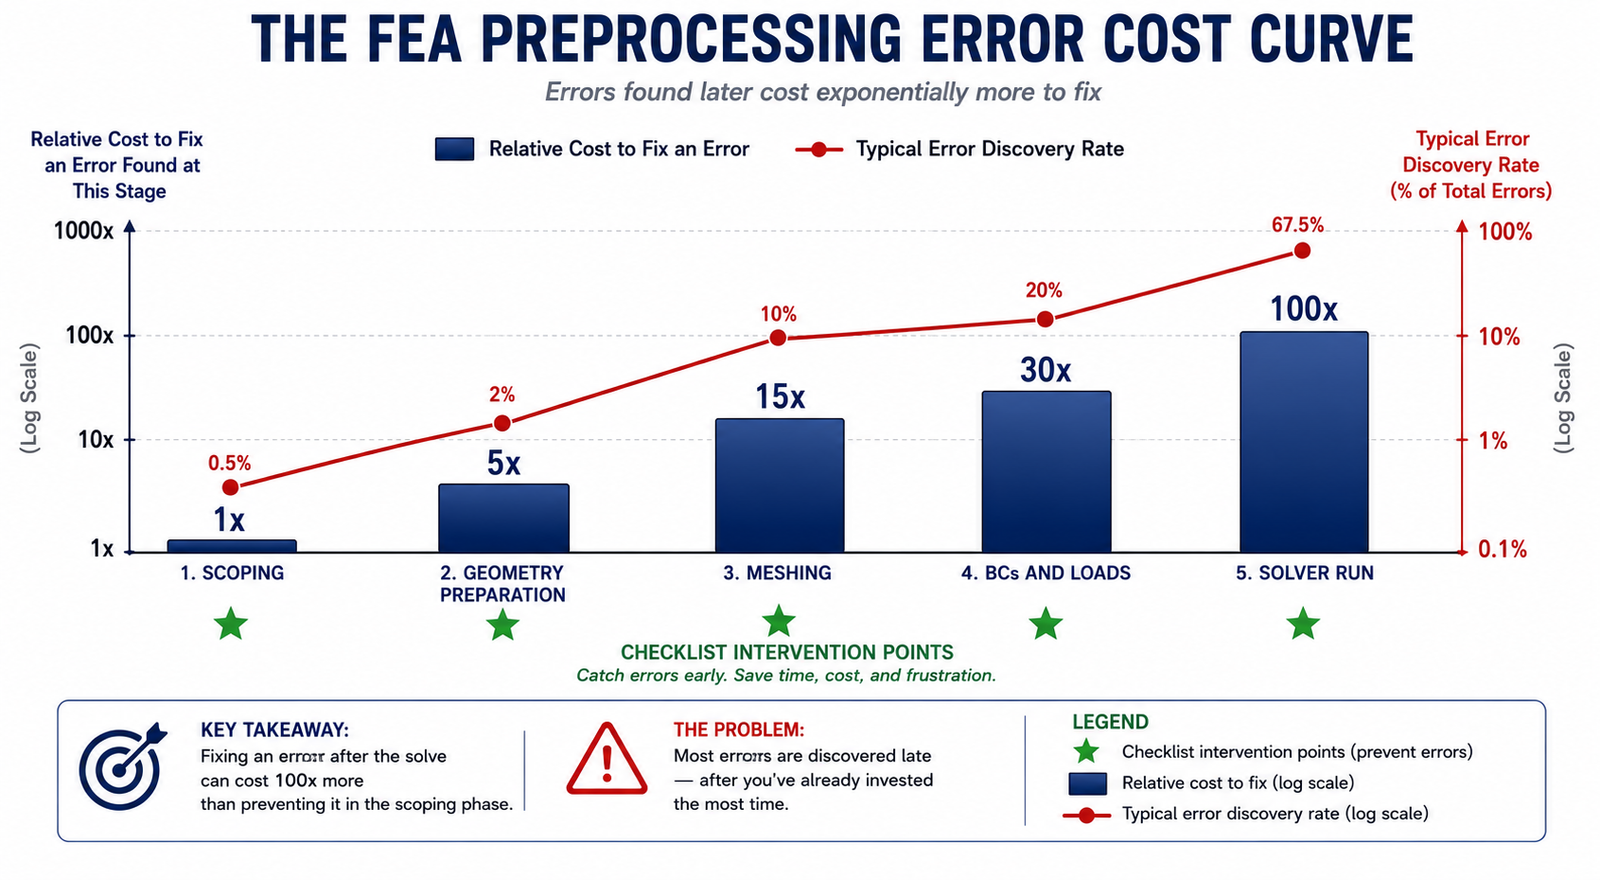
HOW TO USE THIS CHECKLIST Print or keep this checklist open during model setup. Check off each item as it is verified, not as it is set up. There is a difference: setting up a material property is not the same as verifying it against the source datasheet. Setting up a boundary condition is not the same as confirming it matches the physical support behavior. The checklist should be completed by someone reviewing the model setup, not exclusively by the person who built it. Peer review of preprocessing catches errors that the original analyst has become blind to through familiarity with their own setup.
Category 1: Analysis Scoping, Define the Question Before Building the Model
The most expensive preprocessing error is building the wrong model, one that answers a question the engineer did not actually need answered, or one that is missing the output quantities required for the design decision. Analysis scoping establishes what question the FEA must answer, what accuracy is required, what load cases must be covered, and what outputs must be extracted. Every subsequent preprocessing decision, geometry simplification level, element type, mesh density, analysis type, flows from the scoping decisions. Getting scoping wrong means every downstream decision is potentially wrong too.
Checklist Item 1: Confirm the Analysis Objective
Before opening the preprocessing software, write down in one or two sentences exactly what question this FEA analysis is answering. ‘Determine if the bracket will fail’ is not sufficient. ‘Determine the maximum von Mises stress in the bracket under the 5000 N vertical load applied at the tip, and compare it to the yield stress of 350 MPa with a safety factor target of 1.5’ is a complete objective. The objective must specify: the physical quantity of interest (stress, displacement, natural frequency, heat flux), the location of interest (specific feature, maximum over whole model, or both), the load case or cases, and the acceptance criterion.
The analysis objective determines the required fidelity of every subsequent decision. If the objective is to predict whether a part yields under a specified load, a linear static analysis with von Mises stress output is appropriate. If the objective is to predict fatigue life at a specific joint, the analysis requires principal stress amplitude extraction at the joint, a fatigue notch factor, and an S-N curve, inputs that cannot be extracted if they were not set up before the solve. Setting up the output requests before the solve is part of preprocessing, not postprocessing
Checklist Item 2: Identify All Load Cases
A complete load case definition includes all combinations of loads that the structure will experience during its service life, not just the peak load case. Missing a load combination is one of the most consequential scoping errors because the governing load case is not always the one with the largest magnitude. A thermal load combined with a modest mechanical load can produce higher stress at a critical location than the peak mechanical load alone, because the thermal stress adds to the mechanical stress with the same sign in one direction and subtracts in another.
For fatigue analyses, the complete load history, not just the peak load, must be defined at scoping. The fatigue damage accumulated at a specific stress amplitude depends on the number of cycles at that amplitude, which requires the full load spectrum. A fatigue analysis scoped only to the peak load will miss the contribution of lower-amplitude, higher-cycle portions of the load spectrum that may dominate fatigue life for high-cycle applications in the Basquin (power law) regime.
Category 2: Geometry Preparation, The Most Time-Consuming Category
Geometry preparation, cleaning, simplifying, and repairing the CAD model for FEA use, is typically the most time-consuming phase of preprocessing, often consuming 40 to 60 percent of total analysis setup time. It is also the category where the cost of poor preparation compounds most severely: bad geometry produces bad meshes, bad meshes produce wrong results, and the error propagation is not always obvious. A systematic geometry cleanup using the decision table below prevents the most common mesh generation failures and result accuracy problems.
CAD Feature
Why It Causes Problems
Cleanup Action
When to Keep It
Cosmetic chamfers and edge breaks (< 0.5mm)
Mesh generator creates distorted elements to capture tiny geometry; massively increases element count for zero structural benefit
Suppress or remove in preprocessing
Never, below 0.5mm, chamfers have no structural effect; include only in models where surface finish matters for fatigue
Logos, text, and embossed markings
Non-planar surface features cause mesh generation to fail or create highly distorted elements on otherwise flat faces
Suppress all decorative surface features
Never for structural FEA, if appearance matters, keep in visualization model only
Standard hardware (bolts, washers, nuts)
Full bolt thread geometry requires millions of elements to mesh; threads add no load-transfer accuracy vs simplified bolt shank model
Replace with simplified cylinder or beam element for bolt shank; apply preload as force
Only when thread failure is the specific analysis objective, and only model the thread root zone
Fillets on non-critical features (not in load path)
Prevent automatic hex meshing; force tet mesh in regions that do not affect results
Suppress non-load-path fillets; keep only fillets at stress concentration locations
All load-path fillets must be retained, stress concentration at load-path fillet is a primary analysis objective
Thin slivers and short edges
Mesh generator creates needle elements along sliver; element quality fails checks; solver struggles
Merge or remove sliver surfaces; heal short edges to adjacent surfaces
Never, slivers are modeling artifacts, not structural features
Duplicate or overlapping surfaces
Mesh generates double elements at same location; load applied twice; stiffness doubled artificially
Delete duplicates; use geometry repair tools to merge coincident surfaces
Never, duplicates are geometry import errors with no structural meaning
Holes below mesh-size threshold
Tiny holes create mesh singularity zones and do not affect structural response
Suppress holes whose diameter is less than one-quarter of the local mesh size target
Only when fluid passes through the hole (CFD coupling) or when the hole is at a stress concentration location under study
Assembly gaps and mismatches at interfaces
Mesh creates unconnected nodes at interface; load transfer fails silently; no error message
Use CAD repair to close gaps below 0.1mm; use mesh tie or bonded contact for designed clearances
Never, interface gaps are geometry preparation errors that must be resolved before meshing
Checklist Item 5: Units and Scale Verification
The unit system used in the FEA model must be consistent across all inputs: geometry dimensions, material properties, load magnitudes, and output requests must all use the same units. There is no automatic unit conversion in most FEA preprocessors, if the geometry is in millimeters and the material stiffness is entered in GPa (N/m² × 10⁹), the effective stiffness in the model is off by a factor of 10⁹ and all displacements are wrong by that factor.
The most common unit conflict in industrial FEA is between geometry (typically in millimeters for manufactured parts) and material density (often entered in kg/m³ from material datasheets). In a millimeter-Newton-tonne unit system, stress comes out in MPa naturally, but density must be in tonnes per cubic millimeter (t/mm³), for steel, this is 7.85 × 10⁻⁹ t/mm³, not 7850 kg/m³. Entering the datasheet value directly produces a mass matrix that is 10¹² times too large, making all frequency and inertia results completely wrong while leaving static stress results unchanged.
Unit System Quick Reference, Steel Properties in Common FEA Unit Systems
UNIT SYSTEM          | E (Young's Modulus) | Density             | Stress Unit
---------------------|---------------------|---------------------|------------
SI (m, N, kg)        | 210e9 Pa            | 7850 kg/m^3         | Pa
mm-N-t (most common) | 210000 MPa          | 7.85e-9 t/mm^3      | MPa
mm-N-kg (CAUTION)    | 210000 N/mm^2       | 7.85e-6 kg/mm^3     | N/mm^2 = MPa
in-lbf               | 30.0e6 psi          | 0.000284 slug/in^3  | psi

VERIFICATION CHECK: Apply a 1 N force to a 1x1x1 unit cube of steel.
Expected displacement = F/(E*A) = 1 / (E * 1) = 1/E in model length units.
  SI:           delta = 1 / 210e9 = 4.76e-12 m
  mm-N-t:       delta = 1 / 210000 = 4.76e-6 mm
  in-lbf:       delta = 1 / 30e6 = 3.33e-8 in
If your result does not match, your units are inconsistent.

DENSITY UNIT CHECK: Run a modal analysis of the cube. First natural frequency
of a 1x1x1 steel cube (free-free) should be approximately:
  SI (m):   f_1 ~ 80,000 Hz (acoustic mode)
  mm-N-t:   f_1 ~ 80,000 Hz (same physics, same number)
If you get a frequency 1000x or 1e6x different, your density units are wrong.
Category 3: Material Properties, Verified Against Source Data
Material property errors are insidious because they affect every result in the analysis by a fixed multiplier, but that multiplier is often not obvious. A Young’s modulus entered as 200,000 instead of 210,000 MPa (a 5 percent error from misreading the datasheet) produces stress results that are 5 percent wrong everywhere in the model, a systematic error that no mesh refinement or convergence study will reveal, because the physics is internally consistent at the wrong material stiffness.
The Five Material Properties That Must Be Source-Verified
Young’s modulus (E): Primary determinant of displacement and stress under mechanical load. Verify against the material standard (ASTM, EN, JIS) for the specific alloy and temper, not a generic value from memory. E varies by up to 10 percent across aluminum alloys and up to 5 percent for steel alloys in different heat treatment conditions.
Poisson’s ratio (ν): Affects lateral strain and stress in multiaxial stress states. For most metals: 0.27 to 0.33. For rubber and elastomers: approaching 0.5. For composites: highly direction-dependent. Using ν = 0.3 for all metals is acceptable for most structural analyses but introduces up to 10 percent error in highly constrained 3D stress states.
Density (ρ): Required for dynamic analysis, self-weight calculation, and inertia relief. Must be in model units. Verify the unit system before entry. A density of 7850 means very different things in SI (kg/m³, correct for steel) and mm-tonne (t/mm³, which would be 10⁹ times too large).
Yield stress (S_y) and ultimate tensile stress (S_u): Required for nonlinear analysis and safety factor calculation. Must match the specific alloy, temper, and product form (plate, bar, forging), yield stress for a 6061-T6 plate is 276 MPa; for 6061-T651 it is 276 MPa; for 6061-O (annealed) it is 55 MPa. Using the wrong temper value can underestimate or overestimate yield by a factor of 5.
Thermal expansion coefficient (α): Required for thermal stress analysis. For steel: 11 to 13 × 10⁻⁶ /°C. For aluminum: 22 to 24 × 10⁻⁶ /°C. Using the wrong value in a thermal stress analysis produces proportionally wrong thermal stress, a 10 percent error in α produces a 10 percent error in thermal stress.
Orthotropic and Composite Material Direction Verification
For orthotropic materials (composites, timber, rolled plate with directional properties), the material principal directions must be correctly aligned with the geometry coordinate system. An FEA solver applies material stiffness in the directions defined by the material coordinate system. If the fiber direction of a CFRP laminate is defined as the global X direction but the part is oriented so that the fibers run in the Y direction, the axial stiffness (fiber direction, E ~ 150 GPa) and transverse stiffness (matrix direction, E ~ 8 GPa) are swapped. The model is 18 times too flexible in the load direction and 18 times too stiff transversely, an error that no amount of mesh refinement or solver accuracy will correct.
The verification step for orthotropic material direction: apply a unit displacement in the material’s primary fiber direction and confirm that the reaction force corresponds to the fiber-direction modulus. Then apply the same unit displacement in the transverse direction and confirm the transverse modulus. If either check fails, the material coordinate system is incorrectly defined.
Category 4: Element Type Selection, Matching Physics to Formulation
Element type selection is one of the highest-leverage preprocessing decisions. The wrong element type can introduce errors of 20 to 200 percent in peak stress results, larger than almost any mesh density error, while the right element type produces accurate results even with a relatively coarse mesh. The selection must be based on the geometry’s dominant structural behavior: does the structure primarily bend as a thin shell, stretch as a solid body, or carry axial loads as a slender member? Each behavior has an optimal element type, and using a suboptimal type means the element’s mathematical formulation is fighting the physics it is trying to represent.
Geometry Type
Recommended Element
Order
When to Avoid
Key Check
Thin-walled structure (t/L < 0.05)
Shell (QUAD4 / QUAD8)
Quadratic (QUAD8) preferred
When through-thickness stress gradient matters; when contact on curved surface
Midsurface offset correct; thickness assigned correctly; stacking direction for composites
Moderately thin wall (0.05 < t/L < 0.1)
Shell or solid, run sensitivity
Quadratic for both
Solid with only 1-2 elements through thickness gives wrong bending stiffness
If solid: at least 3 elements through thickness for bending accuracy
Solid 3D part, regular geometry
Hexahedral (HEX8 / HEX20)
Quadratic (HEX20) for stress
Avoid where geometry prevents structured hex mesh, distorted hex is worse than good tet
TET4 (linear tet) for stress analysis, 4-10x under-predicts peak stress vs TET10
Sufficient density at stress risers; convergence study mandatory for TET10 models
Slender beam or frame member (L >> cross-section)
Beam (BEAM2 / BEAM3)
Quadratic (BEAM3) for bending
When cross-section stress distribution matters (not just resultant force and moment)
Section properties correctly defined; neutral axis at correct location; shear center
Springs, cables, and 1D connectors
Spring / Truss / RBE
Not applicable
When flexural stiffness matters, spring and truss carry axial force only
Stiffness value in correct units; DOF connections correct for spring type
Axisymmetric geometry and loading
Axisymmetric solid (AXISYM)
Quadratic preferred
When load breaks axisymmetry, use 3D model
Geometry on correct side of axis; loading defined in meridional plane
Plane stress (thin plate in-plane)
Plane stress quad (CPS8)
Quadratic
When thickness is not small compared to in-plane dimensions
Out-of-plane stress is zero by assumption, verify this is physically correct
The Linear vs Quadratic Element Decision
Within each element family, the choice between linear (first-order) and quadratic (second-order) elements is consistently one of the most impactful decisions in preprocessing. Linear elements (TET4, HEX8, QUAD4) have displacement fields that are linear within each element, they cannot represent curved displacement fields without using very fine meshes. At stress concentration locations (notches, holes, fillets), where the stress gradient changes sharply over a short distance, linear elements significantly underestimate the peak stress because they cannot capture the curvature of the displacement field with coarse meshes.
Quadratic elements (TET10, HEX20, QUAD8) have midside nodes and displacement fields that can capture quadratic variation within each element. At stress concentrations, quadratic elements predict peak stresses 20 to 50 percent closer to the converged value with the same number of elements as linear elements. The computational cost per element is approximately 3 to 5 times higher for quadratic elements (more degrees of freedom, larger element stiffness matrices), but the accuracy gain typically more than compensates, fewer elements are needed to achieve the same accuracy, so the total model size is often smaller for a quadratic model than for a linear model at equivalent accuracy.
The specific case where linear elements are preferred over quadratic: explicit dynamics crash and impact analysis. Explicit dynamics solvers use lumped mass matrices for computational efficiency, and quadratic elements with midside nodes produce mass matrices that can cause oscillation instabilities in explicit integration. Most crash simulation codes (LS-DYNA, Abaqus Explicit) use QUAD4 shell elements and HEX8 solid elements as their primary element types for this reason. The very fine mesh required for crash simulation (element sizes of 3 to 10 mm for vehicle crash models) provides the accuracy that would otherwise require quadratic elements.
Mesh quality is the preprocessing category with the most objective criteria, unlike geometry simplification or boundary condition selection, mesh quality can be measured numerically and compared against established thresholds. Every commercial FEA preprocessor provides mesh quality metrics as standard output. The analyst’s job is to run the quality check, identify the elements that fail the acceptance criteria, and improve the mesh in those regions before running the analysis. Running a stress analysis with known poor-quality elements is not a defensible engineering practice, the solver will run, the results will look like results, and the errors introduced by the bad elements will be invisible in the output.
Metric
Definition
Target (Good)
Warning Threshold
Failure Threshold
Fix Strategy
Aspect Ratio
Longest edge / shortest edge of element
< 3:1
3:1 to 5:1, acceptable in low-gradient regions
> 10:1, significant accuracy loss
Refine mesh in elongated direction; use smaller elements near high-gradient regions
Jacobian Ratio
Ratio of minimum to maximum Jacobian determinant within element
> 0.8 (ideal = 1.0)
0.6 to 0.8, monitor accuracy
< 0.4, severe accuracy degradation; < 0 solver failure
Smooth mesh; reduce element distortion at curved boundaries
Warpage Angle
Angle between the two triangles formed by splitting a quad element
< 5 degrees
5 to 10 degrees, acceptable for low-stress regions
> 15 degrees, significant mapping error in curved shells
Use smaller elements; improve surface mesh; remesh curved shell regions
Skewness
Deviation of internal angles from ideal (90 deg for quad, 60 deg for tri)
< 0.5 (0 = perfect)
0.5 to 0.7, borderline
> 0.85, inaccurate; > 0.95 solver may fail
Adjust mesh seed points; use size controls to improve transition
Orthogonality
Angle between element face normal and centroid-to-centroid vector (CFD)
> 0.15 (1 = perfect)
0.05 to 0.15, may affect convergence
< 0.01, CFD solver diverges
Remesh boundary layer; improve mesh at concave geometry
Increase local mesh density; use size controls to prevent sliver tets
Min/Max Angle (Tri)
Internal angles of triangular elements
45 to 90 degrees
30 to 120 degrees, acceptable
< 15 degrees or > 150 degrees, severe accuracy degradation
Remesh region; use advancing front mesher with angle controls
Min/Max Angle (Quad)
Internal angles of quadrilateral elements
70 to 110 degrees
45 to 135 degrees, acceptable
< 30 degrees or > 150 degrees, severe distortion
Smooth mesh topology; split distorted quads into tris if necessary
Checklist Item 16: Mesh Density at Stress Concentrations
The most consequential mesh density decision is the element size at stress concentration locations, notches, holes, fillets, and geometric discontinuities where the stress gradient is steepest. The standard guidance is at least 8 elements spanning the fillet radius circumferentially for capturing the stress concentration factor Kt to within 5 percent of the converged value. For very small radii (r < 1mm) in a large assembly model, this requires a local mesh refinement zone at the feature.
The verification for mesh density at stress concentrations is the mesh convergence study: run the analysis at three successive mesh densities (coarse, medium, fine) at the critical location, and confirm that the peak stress at the critical location changes by less than 2 percent between the medium and fine meshes. If it changes by more, the medium mesh is not converged and the fine mesh is the minimum acceptable density. If the coarse-to-medium change exceeds 10 percent, the coarse mesh is too coarse to provide even a rough estimate.
Checklist Item 18: Node Connectivity at Interfaces
In assemblies with multiple parts, the mesh connectivity at part interfaces is a common source of silent errors. If two parts share a surface (bonded contact, tied interface, or merged nodes), the mesh nodes on the two sides of the interface must be either coincident and merged (for perfect bonding) or correctly defined as a contact pair (for frictional, frictionless, or tied contact). An interface where the meshes are not connected and no contact pair is defined is an invisible gap, the two parts can interpenetrate without load transfer, the solver does not report an error, and the stress result near the interface is meaningless.
The diagnostic for unconnected interfaces: after meshing, inspect the interface visually using a cross-section cut through the interface region. In the preprocessor’s display, connected nodes appear as a continuous mesh; disconnected nodes show two separate mesh boundaries facing each other. Alternatively, apply a small compressive load perpendicular to the interface and check that load is transferred, if the reaction at the far end of the second part shows zero force, the interface is not transmitting load.
Category 6: Boundary Conditions and Loads, The Last Line Before the Solve
Boundary conditions and loads are covered in depth in the dedicated article on FEA boundary condition selection. The preprocessing checklist focuses on the verification steps that confirm what has been set up is correct, not just present. A boundary condition that has been applied to the wrong face, in the wrong direction, or with the wrong constraint type is as wrong as a missing boundary condition, but it produces results that look more plausible and are therefore harder to catch.
Checklist Item 20: The Modal Pre-Check for Rigid-Body Modes
Before running any static or dynamic analysis, run a free-vibration modal analysis requesting the first 12 modes with no preload and no inertia relief. Any mode with a near-zero natural frequency (below 1 Hz for a structural model) is a rigid-body mode, evidence that the boundary conditions have not removed all six rigid-body degrees of freedom. A correctly constrained 3D model returns exactly zero near-zero-frequency modes from this check.
The modal pre-check takes seconds to run and definitively identifies under-constrained models before the full analysis is attempted. It is the single most efficient quality gate in the preprocessing workflow, and it should be a mandatory step before every structural analysis run, regardless of how confident the analyst is in the boundary conditions. Over-constraint (too many BCs) is not caught by this check, it requires inspection of reaction forces after the solve, but under-constraint (the more catastrophic error) is always caught.
Checklist Items 23-27: Load Verification Protocol
Load verification follows a four-step protocol: magnitude, direction, distribution, and unit confirmation. Each step is independent and each can fail independently. A load that is correct in magnitude and direction but applied to the wrong area produces a stress result that is wrong by the ratio of correct to incorrect application area. A pressure load correct in magnitude and area but in the wrong direction (inward instead of outward) produces a structure in compression where the analysis intended tension, potentially inverting the sign of every stress result in the model.
Magnitude: Confirm the numerical value matches the load specification. Check whether the specification gives peak, mean, or RMS value, and whether the FEA load should be the instantaneous peak or a time-averaged value.
Direction: Confirm the load direction vector in the model coordinate system. For loads defined in a local coordinate system, confirm the local system is oriented correctly. Gravity direction is a particularly common error: gravity in the negative Z direction for a model where Z is vertical, but negative Y if Y is vertical in the model coordinate system.
Distribution: Confirm whether the load is a point force, uniformly distributed pressure, linearly varying pressure, or body force. A point force applied to a single node produces a stress singularity at that node; a distributed pressure over the correct area gives physically meaningful stress.
Units: Confirm load units match the model unit system. A force of 5000 N in an SI model is correct; the same value in an mm-N model is also 5000 N. But a pressure of 5 MPa is 5 N/mm² in mm units and 5,000,000 Pa in SI, the same numerical value means completely different physical loads in different unit systems.
Unit System Reference: The Most Common Source of Silent Preprocessing Errors
Unit system inconsistency is the most common source of FEA errors that pass through the solver without triggering any error or warning messages. The model solves, the results look plausible, and the error is only discovered when results are compared against a hand calculation or a physical test. The unit reference table below covers the five unit systems most commonly encountered in industrial FEA, with the correct property values for steel in each system as a verification reference.
Unit System
Length
Force
Mass
Stress / Pressure
Density
Common In
SI
m
N
kg
Pa (N/m^2)
kg/m^3
Academic, European engineering, most FEA defaults
SI (mm-N)
mm
N
t (tonne)
MPa (N/mm^2)
t/mm^3
Most common in industrial FEA, stress directly in MPa
SI (mm-kg)
mm
N
kg
MPa
kg/mm^3
Sometimes used, CAUTION: density must be in kg/mm^3 (steel = 7.85e-6)
Imperial
in
lbf
slug
psi (lbf/in^2)
slug/in^3
US aerospace and legacy codes; stress in psi
CGS
cm
dyne
g
dyne/cm^2
g/cm^3
Rarely used in FEA; some academic codes
THE UNIT SYSTEM VERIFICATION TEST, RUN THIS BEFORE EVERY ANALYSIS Create a simple test geometry: a 1x1x1 unit cube of the target material. Apply a 1-unit force (1 N, or 1 lbf in imperial) to one face, fixed at the opposite face. The expected axial displacement is F/(E*A) = 1/E in model length units. For steel in mm-N-t: delta = 1/210000 = 4.76e-6 mm. Run the modal analysis of the same free-free cube, the first acoustic frequency should be consistent with the wave speed in steel (approximately 5100 m/s or 5.1 mm/us) and the cube dimension. If either check fails, the unit system is inconsistent and must be corrected before the real model is run. This test takes five minutes and has saved analysts from reporting results that are wrong by factors of 10^3 to 10^9.
The Pre-Solve Final Review: Five Minutes That Prevent Fourteen-Hour Reruns
Before submitting the analysis for solution, especially before committing to a long HPC run, a five-minute final review of the complete model setup catches the errors that individual checklist items can miss. This review is distinct from the checklist: it looks at the model as a whole rather than individual items, checking for logical consistency across all preprocessing decisions.
The Five-Point Final Review
Render the model geometry in the preprocessor and visually inspect it: Does the geometry look correct? Are there obviously missing or duplicated parts? Is the scale plausible, does a 100mm bracket look like a 100mm bracket? Visual inspection at this stage catches geometry import errors, incorrect CAD simplifications, and unit scaling errors that result in geometry that is the right shape but the wrong size.
Display boundary conditions and loads on the model: Most preprocessors can display BC symbols (arrows for constraints, pressure arrows for loads) on the model geometry. Confirm that constraint arrows appear at the correct faces and in the correct directions. Confirm that load arrows appear at the correct faces, with the correct magnitude and direction. A BC applied to the wrong face is immediately visible in this display; a missing BC shows as an unadorned face where an arrow should appear.
Check the element type and material assignment for every part: In assembly models with multiple parts, it is easy to assign the wrong material or element type to one component. Review the material and element assignment list in the preprocessor and confirm that every part has the correct assignment. Parts with no material assigned are particularly dangerous, some preprocessors use a default material silently rather than flagging the omission.
Confirm the analysis type and output requests: Verify that the analysis type (linear static, nonlinear, modal, harmonic, transient) matches the physics of the problem. Confirm that the requested outputs include all quantities needed for the design decision: at minimum, stress tensor components or principal stresses, displacements, and reaction forces. If fatigue life, strain energy, or frequency response is needed, confirm those outputs are explicitly requested before the solve.
Estimate expected results from a hand calculation: Before submitting the job, compute an expected order of magnitude for the peak displacement and peak stress using a simplified hand model (beam theory, thin-wall pressure vessel, etc.). Write down the expected values. After the solve, compare the FEA result against this estimate. Agreement within 20 to 30 percent confirms that the physics is being modeled correctly. A factor-of-10 disagreement indicates a preprocessing error that must be investigated before the results are used.
Frequently Asked Questions
Q: What is the most common FEA preprocessing error?
The most common preprocessing error, measured by frequency of occurrence in industrial FEA practice, is unit system inconsistency, specifically, entering material density in SI units (kg/m^3) in a model whose geometry is defined in millimeters. This error does not affect static stress results (density does not enter the static equilibrium equation) and produces no error message, so it passes through the solver undetected.
The error only appears in dynamic analysis results (natural frequencies, inertia forces, self-weight) which are wrong by a factor equal to the square root of the density error ratio. The fix is a simple unit system verification test run before any dynamic analysis: apply a known load to a unit cube of the material and verify the displacement, then run a modal analysis and verify the fundamental frequency.
Q: How many elements do I need at a stress concentration?
The minimum for reliable stress concentration factor prediction is 8 elements spanning the fillet radius circumferentially, using quadratic elements (TET10, HEX20, or QUAD8). This density typically predicts the peak stress within 5 percent of the converged value for most fillet geometries. For sharp notches with root radii below 0.5mm, 12 to 20 elements across the radius may be needed, and a mesh convergence study is mandatory. The convergence criterion: the peak stress at the stress concentration should change by less than 2 percent between successive mesh refinements (coarse to medium to fine) before the result is accepted. Do not rely on the absolute element count, verify convergence by running the study.
Q: Should I use TET4 or TET10 elements for solid parts?
Always use TET10 (quadratic tetrahedral) elements for solid parts where stress accuracy matters. TET4 (linear tetrahedral) elements are too stiff in bending, a consequence of their constant strain field formulation, and significantly under-predict deflections and peak stresses at stress concentrations. For a curved fillet where the peak stress is the analysis objective, TET4 elements can under-predict the peak by 30 to 50 percent compared to the converged result, even with a very fine mesh. TET10 elements require approximately 3 to 5 times more computation per element but produce dramatically better stress predictions at the same mesh density. The only legitimate use of TET4 is as a rapid approximation for checking geometry or connectivity, never for final stress results.
Q: How do I check if my model has rigid-body motion?
Run a free-vibration modal analysis requesting the first 10 to 12 modes before submitting the static analysis. In a correctly constrained 3D model, all modal frequencies are above zero (typically the first mode is above 10 Hz for a stiff structure and above 1 Hz for a flexible one). Any mode with a frequency essentially equal to zero (the solver may report it as 0.001 Hz or 0.0 Hz depending on numerical precision) is a rigid-body mode, evidence of an unconstrained degree of freedom.
Identify which mode shape corresponds to the near-zero frequency: translation in X, Y, or Z, or rotation about X, Y, or Z. That identifies which constraint is missing. Add the constraint, re-run the modal check, and repeat until all near-zero modes disappear.
Q: What is the difference between bonded contact and merged nodes at an interface?
Merged nodes (or equivalencing, as it is called in Nastran and Abaqus) creates a single set of nodes shared by both parts at the interface, the parts are topologically connected and there is no contact computation. This is the most computationally efficient way to model a bonded interface with no relative slip possibility. Bonded contact defines a contact pair between two surfaces, with a constraint that prevents separation and relative sliding, it is slightly more expensive computationally but does not require mesh compatibility (the two surface meshes can have different node patterns).
For bonded interfaces where no separation or sliding is possible under any load case, merged nodes are preferred for efficiency. Use bonded contact when: the meshes on the two sides are incompatible (different element sizes or patterns), when you need to extract interface stresses or separation forces, or when the bonding may be conditional (bonded in compression, open in tension), in which case a more sophisticated contact formulation is needed.
Q: How long should FEA preprocessing take?
Preprocessing time scales with model complexity and the analyst’s experience and tool proficiency, but a useful benchmark is that preprocessing (geometry cleanup, meshing, BC setup, load application, and pre-solve verification) should take 3 to 5 times longer than the solver run for a well-organized analysis. If preprocessing takes less than the solver run, the setup is probably too rushed and systematic checks are being skipped.
If preprocessing takes more than 10 times the solver run, either the geometry is excessively complex and needs simplification, or the analyst’s geometry cleanup workflow needs efficiency improvement. For a linear static analysis that solves in 2 hours, 6 to 10 hours of preprocessing is typical for a moderately complex assembly. For a 24-hour crash simulation, 3 to 7 days of preprocessing is normal, crash simulation preprocessing is among the most time-intensive in industrial FEA.
Conclusion:
FEA preprocessing is the phase of the analysis where engineering judgment is most heavily exercised and where errors are most consequential. The solver is largely deterministic, given a correct model, it will return a correct result. But the model correctness depends entirely on the hundreds of decisions made during preprocessing: which features to simplify, what element type to use, whether the material coordinate system is aligned with the fiber direction, whether the boundary condition constrains the right degrees of freedom, whether the load is applied in the correct direction. Each decision is an opportunity for error, and the solver cannot distinguish between a correct model and a plausible-looking incorrect one.
The 30-point checklist in this article is a systematic defense against preprocessing error, not because it catches every possible mistake, but because it forces the analyst to explicitly verify each category of decision rather than assuming it is correct because it was set up without obvious problems. The checklist items labeled Critical are the ones where a single error produces results that are wrong by a factor of 2 or more. The items labeled High produce errors of 10 to 50 percent. Together, they cover the preprocessing decisions responsible for the large majority of wrong FEA results in industrial practice.
Use this checklist before every analysis run. Use it during peer review of other analysts’ models. Build it into the analysis quality plan for any project where the FEA results will be used to make a design decision, support a regulatory submission, or verify structural integrity. The minutes spent checking are the insurance policy against the hours spent rerunning, and against the much greater cost of a field failure that a correct analysis would have predicted.
Extend your FEA knowledge with our guides on boundary condition selection, static vs dynamic analysis, stress concentration analysis, mesh quality and convergence, and common FEA errors that produce wrong results despite correct solver execution.
The Boeing 777 was the first commercial aircraft designed entirely on computers, no physical mockup was built before the first flight. The development team ran over 600 wind tunnel simulations digitally before any physical tunnel time was used for final validation. The aircraft entered service within budget, with no major design changes required after first flight. For comparison, the 767 program that preceded it required extensive physical mockup work and multiple design iterations discovered only through hardware testing. The shift was not in the engineers’ skill, it was in the workflow. Simulation had become the primary design tool, and physical testing had become the validation step for a design already understood through analysis.
That shift, from test to validate an unknown design to simulate to understand, then test to confirm, is what simulation-driven design means in practice. It is not a replacement for physical testing. It is a restructuring of the development process so that problems are found and solved in software, where iterations cost hours and dollars, rather than in hardware, where iterations cost weeks and millions. The industries that have made this shift most completely are the ones where the combination of competitive pressure, safety requirements, and engineering complexity has made the old prototype-heavy workflow untenable.
This article examines the ten industries where simulation-driven design has delivered the greatest measurable impact: the specific simulation types each industry uses, the business problems that drove adoption, the ROI metrics that justify simulation investment, and the particular use cases that illustrate how simulation changes outcomes. It also covers the eight value levers through which simulation delivers returns across all industries, because while the applications differ, the economic logic of replacing expensive physical iteration with cheap digital iteration is universal.
The Economic Logic of Simulation-Driven Design
The business case for simulation-driven design rests on a single asymmetry: the cost of finding a design problem grows by roughly an order of magnitude at each successive stage of product development. A stress concentration discovered in the CAD model costs an engineer a few hours to redesign. The same problem discovered in a physical prototype costs the prototype build cost plus the test cost plus the redesign cycle, typically 10 to 50 times more. Discovered in field service after product launch, the same problem costs warranty claims, potential recall, liability exposure, and brand damage, 100 to 10,000 times more than the CAD-stage fix.
Simulation-driven design moves problem discovery as early as possible in the development process, before physical hardware exists. Every iteration that simulation handles, every design variant evaluated, every load case checked, every failure mode explored, is an iteration that does not require a physical build-and-test cycle. The return on simulation investment is fundamentally a function of how many physical iterations it displaces and how far into the development process those iterations would have occurred without simulation.
The Eight Value Levers: How Simulation Delivers Returns
Across all ten industries covered in this article, simulation delivers business value through eight distinct levers. Understanding which levers are most important in a given industry explains why simulation adoption has proceeded at different rates and produced different returns in different sectors.
Value Lever
What Simulation Replaces or Reduces
Typical Saving
Industries Where This Dominates
Physical prototype reduction
Physical builds, tooling, materials, lab technician time
Fewer physical prototypes and reduced development costs in organizations with mature simulation practices.1
Automotive, consumer products, medical devices, electronics
Root cause investigation, recall costs, brand damage from field failures
Lower risk of field failures through earlier identification of design issues.
Automotive, consumer products, medical devices
Regulatory submission support
Additional physical testing required by regulators; repeated submissions due to test failures
Faster approval timelines; simulation evidence accepted in lieu of some physical tests
Medical devices (FDA), aerospace (FAA/EASA), nuclear (NRC)
Process and yield optimization
Pilot plant trials, batch failures, scale-up surprises in chemical and pharmaceutical processes
Significant reduction in pilot plant duration and cost; improved first-pass yield
Pharmaceutical, chemical processing, food and beverage
Asset life extension
Conservative decommissioning of structures with remaining life; unplanned maintenance
Change to Extended service life through validated fitness-for-service assessments.
Oil and gas, civil infrastructure, power generation
Industry Summary: Simulation Types, Drivers, and Maturity
The following table summarizes how simulation-driven design manifests across the ten industries covered in this article, including the primary simulation types used, the key business driver that motivates investment, and the maturity level of simulation adoption in each sector.
Process safety, reaction yield optimization, equipment integrity
Reduced pilot plant testing; process scale-up de-risked by CFD
Medium, CFD for mixing and reactor design growing; structural well established
1. Aerospace and Defense: Where Simulation Is Mandatory
Aerospace and defense is where simulation-driven design is most deeply embedded, most rigorously validated, and most tightly integrated with regulatory requirements. The FAA and EASA do not simply accept simulation results as supporting evidence, in many cases, simulation is the required method. AC 20-107B (composite aircraft structure) and AC 25.571 (damage tolerance and fatigue) define the analytical methods that must be applied to demonstrate airworthiness, and FEA is central to both. An aircraft that cannot be certified through analysis cannot enter service, regardless of how well it performs in flight test.
The primary simulation types in aerospace are structural FEA for primary and secondary structure, computational fluid dynamics for aerodynamic performance and thermal management, aeroelastic analysis (coupling structural FEA with aerodynamic loads to predict flutter, divergence, and control surface effectiveness), fatigue and damage tolerance analysis, and impact simulation for bird strike and engine containment requirements. For space applications, thermal analysis under vacuum cycling, acoustic vibration during launch, and hypervelocity impact simulation for orbital debris are added to this list.
Weight Reduction: The Dominant Value Driver
In aerospace, every kilogram of structural weight saved translates directly into either payload capacity or fuel burn reduction. The rule of thumb for commercial aircraft is that 1 kg of structural weight saving is worth approximately $1,000 to $3,000 in lifetime fuel cost per aircraft, depending on fuel price and aircraft utilization. For a fleet of 500 aircraft, a 100 kg structural optimization, entirely achievable through simulation-driven topology optimization and refined stress analysis, represents $50 million to $150 million in fleet-level fuel savings over the aircraft’s service life.
Simulation enables weight reduction by allowing engineers to reduce the uncertainty margin in structural sizing. Traditional design relied on conservative empirical safety factors because the actual stress distribution in complex joints, cutouts, and composite laminates could not be precisely calculated by hand. FEA resolves the actual stress field with sufficient accuracy that the structural sizing can be driven to the actual load limit rather than a conservative bound. The weight saved is the material that was previously added to cover analytical uncertainty, material that simulation reveals to be unnecessary.
Composite Structure: Where Simulation Is Irreplaceable
Modern aircraft primary structure is predominantly carbon fiber reinforced polymer (CFRP) composite. The mechanical behavior of composites, ply-by-ply stress distribution, interlaminar shear, delamination initiation, and progressive failure under combined loading, cannot be predicted by closed-form analysis for any realistic geometry. FEA with progressive damage models is the only viable analytical method for composite certification analysis. The development of the Boeing 787, Airbus A350, and their successors required extensive composite simulation capability that did not exist in the 1990s. The weight savings that make these aircraft economically viable, 20 percent fuel burn improvement over equivalent aluminum aircraft, are only achievable because composite structure can be accurately analyzed through simulation.
2. Automotive: The Highest Simulation Volume Industry
The automotive industry runs more simulation hours per product program than any other industry on earth. A new vehicle platform at a major OEM involves hundreds of thousands of individual FEA and CFD analyses spread across crash safety, noise-vibration-harshness (NVH), aerodynamics, powertrain thermal management, fatigue durability, manufacturing process simulation, and pedestrian safety. The simulation infrastructure at a major OEM, software licenses, high-performance computing clusters, validation databases, simulation process automation, represents an investment of hundreds of millions of dollars. This is not optional: it is the only way to develop a vehicle in 24 to 36 months that meets the safety, emissions, and performance requirements of global markets.
Crash Simulation: The Most Consequential Application
The most visible and most consequential simulation application in automotive is crash analysis. A full frontal crash simulation, one vehicle impacting a rigid barrier at 56 km/h, as required by NCAP and FMVSS 208, involves an explicit dynamics FEA model with 5 to 15 million elements, a time duration of 100 to 150 milliseconds, and a time step in the microsecond range.
The analysis captures the complete crushing sequence of the front end energy absorbers, the intrusion into the occupant cell, the airbag deployment timing, and the forces transmitted to the occupant through the seat belt and airbag system. A single crash simulation run takes 8 to 24 hours on a dedicated HPC cluster with 64 to 256 CPU cores.
Without crash simulation, the only way to evaluate a structural design change is to build a physical prototype and test it, a process that costs $150,000 to $500,000 per test for the prototype build and test facility time, and takes 8 to 16 weeks for the build-to-test cycle. A crash simulation run costs a few hundred dollars in compute time and returns results in less than a day. A major OEM runs 50 to 200 crash simulations per week during peak development, exploring design variants and load cases that would be financially and temporally impossible to evaluate through physical testing alone.
NVH: The Quality Differentiator
Noise, vibration, and harshness (NVH) performance is one of the primary differentiators of vehicle quality perception. The low-frequency boom of a diesel engine at idle, the wind noise at highway speed, the impact harshness over road irregularities, the tonal quality of the door close sound, all of these are engineering outcomes that can be predicted and optimized through simulation before any physical vehicle exists. NVH simulation uses modal analysis to predict structural resonances, harmonic response to evaluate excitation from powertrain and road inputs, and acoustic FEA or boundary element methods to predict interior sound pressure levels.
The EV transition has made NVH simulation even more critical. Internal combustion engines mask high-frequency structural and wind noise through their own broadband noise floor. Electric powertrains are nearly silent, making previously inaudible structural resonances, gear whine, inverter switching noise, bearing tone, suddenly perceptible to occupants. OEMs developing EV platforms have had to rebuild their NVH simulation models from scratch to capture frequency ranges (2,000 to 8,000 Hz) that were irrelevant in ICE vehicles, investing heavily in high-frequency FEA and acoustic simulation capability that did not exist in their ICE-era toolchains.
3. Medical Devices: Simulation as Regulatory Evidence
The medical device industry has a unique relationship with simulation: in addition to its engineering value in reducing prototypes and improving design, simulation output can be submitted directly to the FDA as evidence supporting device clearance or approval. The FDA’s guidance on computational modeling and simulation (issued 2016, updated 2019) and the ASME V&V 40 standard for medical device simulation credibility together define a framework under which simulation results, if generated with demonstrated credibility, can substitute for some physical bench tests in a regulatory submission. This transforms simulation from an engineering cost center into a regulatory strategy tool.
The medical device applications of simulation span implant structural analysis (hip and knee prostheses under walking, stair-climbing, and fall loading scenarios per ISO 14242 and ISO 14243), cardiovascular device fluid dynamics (heart valve opening and closing, stent deployment and hemodynamics, left ventricular assist device flow fields), spinal implant fatigue analysis, orthopedic screw pull-out prediction, and catheter and guidewire flexibility simulation for interventional devices.
Orthopedic Implants: Fatigue Life Prediction Under Physiological Loading
Hip and knee replacement implants must survive at least 10 million loading cycles, representing approximately 10 years of patient activity, without fatigue fracture. Physical fatigue testing to 10 million cycles at physiological load rates takes months of continuous testing on specialized rigs. Simulation allows the engineer to evaluate multiple implant geometries and surface finish variants in parallel, identify the fatigue-critical location from the maximum principal stress amplitude, and select the geometry that minimizes stress concentration at the critical location before any physical testing begins.
The FDA’s acceptance of simulation evidence for orthopedic implants is well-established: finite element analysis of implant stress under the loads defined in ISO 14242 (hip) and ISO 14243 (knee) is a standard component of 510(k) and PMA submissions for total joint replacement devices. Simulation does not eliminate the physical fatigue test, it focuses the physical test on the design that simulation has already shown to be the best candidate, reducing the number of physical test iterations from four to six to one or two.
Cardiovascular CFD: Blood Flow, Hemolysis, and Thrombosis Risk
Computational fluid dynamics in cardiovascular devices addresses questions that physical testing cannot answer directly: the shear stress on blood cells as they pass through a heart valve orifice (governing hemolysis risk), the residence time of blood in regions of flow stagnation (governing thrombosis risk), and the pressure drop across a device (governing the hemodynamic burden on the patient’s heart). These are fluid dynamics quantities that require CFD to compute, no physical test can directly measure shear stress on individual red blood cells in a flowing field.
The FDA’s guidance on heart valve simulation (referencing ISO 5840) explicitly describes the use of CFD for flow field characterization and the acceptable validation methodology. For transcatheter heart valves, one of the most rapidly growing device categories, CFD simulation of the deployed valve geometry is standard practice in the development workflow at every major cardiovascular device company. The simulation informs leaflet geometry optimization, frame design, and deployment configuration, reducing the number of in-vitro and animal study iterations required before first-in-human trials.
4. Oil and Gas: Simulation for Asset Integrity and Life Extension
The oil and gas industry’s motivation for simulation is different from consumer-facing industries: it is not primarily about reducing time to market or cutting prototype costs. It is about preventing catastrophic failures in equipment that operates under extreme conditions, high pressure, high temperature, corrosive fluids, cyclic loading from waves and currents, and remoteness that makes inspection and maintenance expensive. An unplanned shutdown of an offshore production platform costs $1 million or more per day in lost production and intervention costs.
A structural failure of a subsea pipeline or riser can cost billions in response, cleanup, and liability. The ROI calculation for simulation in this industry is asymmetric: the simulation investment is measured in thousands to hundreds of thousands of dollars; the failure it prevents is measured in millions to billions.
The primary simulation applications are pressure vessel and piping stress analysis per ASME Section VIII and B31.3, fatigue analysis of offshore risers and mooring systems under wave and current loading per API RP 2A and DNV standards, CFD for flow assurance (multiphase flow behavior in pipelines, slug flow prediction, hydrate formation risk), thermal stress analysis of high-temperature process equipment, and fitness-for-service assessment of aging equipment with detected flaws per API 579 / BS 7910.
Fitness-for-Service: Simulation Extending Asset Life
One of the highest-value simulation applications in oil and gas is fitness-for-service (FFS) assessment of equipment with detected damage, corrosion, erosion, fatigue cracks, dents, and gouges found during inspection. Without simulation, the conservative approach is to decommission or replace any equipment where the remaining wall thickness falls below a code minimum or where a flaw exceeds a simplified acceptance criterion. With FFS simulation using fracture mechanics FEA, the analyst can demonstrate that a specific flaw in a specific location under the actual loading conditions will not propagate to failure within a defined inspection interval, allowing continued operation of equipment that a simplified code check would have condemned.
API 579 / ASME FFS-1 defines three levels of FFS assessment: Level 1 (simplified charts and tables), Level 2 (more detailed calculation methods), and Level 3 (advanced analysis including FEA). Level 3 FFS assessments using fracture mechanics FEA routinely extend the service life of offshore platforms, subsea pipelines, and process vessels by five to fifteen years beyond what simplified assessment would permit, representing asset value of hundreds of millions of dollars per major installation
Subsea Riser Fatigue: The Long-Duration Dynamic Analysis Challenge
Subsea risers, the pipes connecting seabed wellheads to floating production vessels, experience continuous fatigue loading from wave-induced vessel motion, vortex-induced vibration (VIV) from ocean currents, and installation loads. The cumulative fatigue damage over a 20-year field life must be predicted during the design phase to ensure that inspection intervals are set correctly and that fatigue life targets are met. This requires dynamic analysis of the riser system over thousands of sea states, each represented by a wave height and period with associated probability of occurrence, integrated over the full 20-year period to produce cumulative fatigue damage predictions at every weld location on the riser
The simulation workflow for riser fatigue involves hydrodynamic load calculation using Morison’s equation or full 3D CFD, structural dynamic analysis of the riser string under those loads, stress concentration factor extraction at critical weld locations, S-N fatigue life prediction per DNV RP C203, and probabilistic combination of results across all sea states. Without simulation, this calculation is impossible, no physical test can replicate 20 years of ocean exposure in a controlled laboratory environment. Simulation is the only design tool available for this application.
5. Civil and Structural Engineering: Code Compliance and Optimization
Civil and structural engineering was an early adopter of FEA, the method was developed in part for structural analysis of aircraft and bridges in the 1950s and 1960s. But the industry’s relationship with simulation is different from manufacturing industries: in civil engineering, the structure is typically unique (each bridge, building, or dam is a one-off), the design life is measured in decades to centuries, and the regulatory framework (building codes, bridge standards, dam safety regulations) defines explicit analytical requirements that simulation must satisfy.
The business case is less about prototype reduction (there are no prototypes in civil engineering) and more about material optimization, code compliance demonstration for novel structures, and seismic or wind performance prediction for structures where simplified code methods are insufficient.
Seismic Analysis: Where Dynamic Simulation Is Code-Required
For structures in seismic zones, building codes (ASCE 7 in the United States, Eurocode 8 in Europe, IS 1893 in India) require dynamic analysis for irregular structures, tall buildings, and critical facilities. Response spectrum analysis and nonlinear time history analysis are mandated analytical methods, not optional enhancements. An irregular 40-story building in a high-seismic zone in San Francisco cannot be designed using the simplified equivalent lateral force method that the code allows for regular, low-rise structures. The response spectrum or nonlinear time history analysis is not just an engineering tool, it is a regulatory requirement.
Performance-based earthquake engineering (PBEE), the methodology behind modern seismic design codes, uses nonlinear FEA to predict structural behavior not just at code-level design earthquakes but across the full range of ground motion intensities, from serviceability-level events to maximum credible earthquakes. This requires nonlinear material models for concrete crushing and steel yielding, large-deformation geometry, and structural collapse prediction through incremental dynamic analysis. No simplified hand calculation method can perform this analysis, FEA is the only viable tool.
Wind Engineering: CFD for Tall Buildings and Long-Span Bridges
Wind loads on tall buildings and long-span bridges cannot be accurately predicted by the pressure coefficients in building codes for structures above approximately 200 meters in height or bridges with spans above approximately 500 meters. For these structures, computational wind engineering, CFD simulation of the wind flow field around the structure, is the accepted alternative to physical wind tunnel testing, and is often used in combination with wind tunnel studies to validate and extend the CFD results.
The most dramatic historical example of wind engineering failure is the Tacoma Narrows Bridge collapse of 1940, which failed in aeroelastic flutter at a wind speed far below its design wind load. Modern bridge design uses coupled CFD and structural FEA, exactly the aeroelastic analysis that was not available in 1940, to predict flutter onset speed, vortex-induced vibration response, and buffeting loads from turbulent wind. Every major long-span bridge designed since the 1970s has used wind engineering simulation as a core design tool, driven directly by the lessons of Tacoma Narrows.
6. Electronics and Semiconductors: Thermal Simulation as a Survival Tool
In electronics, simulation is not a competitive differentiator, it is a survival requirement. The thermal limits of semiconductor devices are absolute: junction temperatures above the rated maximum (typically 125°C to 175°C for silicon) degrade performance, accelerate electromigration, and ultimately cause permanent failure. A device that overheats fails. A PCB layout that creates hotspots produces unreliable products. The thermal design of any electronic system, from a smartphone processor to a power inverter to a satellite transmitter, must be resolved before first silicon or first board spin, because the cost of discovering a thermal problem in hardware is an entirely new design and fabrication cycle.
The primary simulation types in electronics are thermal FEA for package and PCB-level thermal resistance calculation, computational fluid dynamics for heat sink and system-level airflow optimization, structural FEA for PCB mechanical stress under mounting and connector loads, random vibration analysis for PCB solder joint fatigue life prediction under transportation and operating vibration environments, and electromagnetic simulation for EMI/EMC compliance prediction.
Power Electronics: Thermal Cycling Fatigue of Solder Joints
Power electronic modules, IGBTs, MOSFETs, diodes in inverters and converters, experience large thermal cycles as the power load varies. Each thermal cycle stresses the solder joints and die attach layers between the semiconductor die and the substrate, accumulating fatigue damage. Solder joint fatigue is the primary failure mechanism in power electronics, and the number of thermal cycles to failure depends on the temperature range, the mean temperature, the dwell time at peak temperature, and the coefficient of thermal expansion mismatch between the die, solder, and substrate materials.
Simulation of thermal cycling fatigue in power modules uses coupled thermal-structural FEA: the thermal analysis predicts the temperature distribution as a function of power dissipation and cooling conditions, and the structural analysis computes the resulting thermal stresses and plastic strains in the solder layer. Coffin-Manson fatigue models applied to the simulated plastic strain range predict cycles to failure. This simulation workflow is the standard reliability prediction method for power module qualification across the automotive, industrial, and renewable energy power electronics industries, replacing or reducing the extensive physical thermal cycling tests previously required.
7. Consumer Products: Drop Test Simulation and Time-to-Market
Consumer product development operates under a time and cost pressure that manufacturing industries do not face in the same form: product cycles are measured in months, not years, and the cost of delaying a product launch by even one quarter can exceed the entire simulation investment many times over. A smartphone OEM that misses the holiday launch window loses not just the delayed revenue but the market positioning advantage. In this environment, any tool that compresses the design-validate-launch cycle has immediate and quantifiable business value.
The primary simulation applications in consumer products are drop test simulation (predicting failure of screens, housings, internal components under the free drops specified by MIL-STD-810 or product-specific internal standards), injection mold flow simulation (predicting fill pattern, weld lines, warpage, and cooling time before tooling is cut), structural FEA for hinge and latch mechanisms under repeated operation loading, vibration fatigue for portable devices used in high-vibration environments, and ergonomic stress analysis for handles and grips.
Smartphone Drop Test Simulation: The iPhone Effect
The smartphone industry has driven the development of drop test simulation capability more than any other consumer product sector. A modern smartphone must survive drops onto concrete from a height of 1.5 to 1.8 meters in multiple orientations, corner drop, edge drop, flat drop, without screen fracture or functional failure. The glass ceramic screen materials (Corning Gorilla Glass, Schott Xensation) have complex fracture behavior that must be captured by explicit dynamics FEA with cohesive zone fracture models or element deletion at the failure stress.
Each smartphone generation involves hundreds of drop simulation runs across all drop orientations, all housing material variants, and all protective case configurations. Physical drop testing at the scale that simulation enables would require $20 million to $50 million per product generation in prototype builds and test facility time, an investment that is simply not feasible on a one-year product cycle. Simulation compresses this to a fraction of the cost and a fraction of the time, allowing design optimization of housing geometry, internal support structure, and glass attachment method before any physical prototypes are built.
8. Renewable Energy: Simulation for 20-Year Fatigue Life Certification
The renewable energy industry, wind turbines, solar installations, and energy storage systems, faces a unique simulation challenge: components must be designed for 20 to 30 years of fatigue life under variable, stochastic loading, and the certification standards that govern this design (IEC 61400 for wind turbines, IEC 61215 for PV modules) require specific simulation methods to demonstrate fatigue life compliance. Like aerospace, simulation in renewable energy is not just an engineering tool, it is a certification requirement.
Wind Turbine Blade Structural Analysis
A wind turbine blade is one of the most mechanically demanding structural components in any industry: it must be simultaneously stiff enough to avoid striking the tower under maximum load, flexible enough to shed extreme wind loads through aeroelastic deflection, light enough to minimize fatigue loads at the hub, and strong enough to survive 20 years of fatigue loading from billions of load cycles at varying wind speeds and directions. The blade structural design uses coupled aeroelastic-structural simulation, the aerodynamic load model and the structural FEA are iterated together because the blade deflection changes the aerodynamic load distribution, which changes the deflection, which changes the load
IEC 61400-1 defines the design load cases, the combinations of wind speed, turbulence, direction changes, grid faults, and emergency stops, that a wind turbine must be analyzed against. There are more than 50 design load cases in the standard, each requiring a time-domain aeroelastic simulation typically 600 seconds in duration. For a turbine with a 20-year design life, the simulation covers a statistically representative sample of all operating conditions the turbine will experience, and the resulting fatigue loads are integrated to produce cumulative damage at every structural joint and bonded connection in the blade, hub, tower, and foundation.
Offshore Wind: Foundation Optimization
Offshore wind turbine foundations, monopiles, jacket structures, and floating platforms, are a major cost driver for offshore wind energy, representing 20 to 35 percent of installed project cost for fixed-bottom installations. Foundation geometry optimization through structural FEA and geotechnical simulation can reduce foundation steel weight by 10 to 20 percent, translating directly to levelized cost of energy (LCOE) reduction. For a 1 GW offshore wind project with 100 turbines, a 15 percent foundation steel reduction is worth $30 million to $50 million in material and installation cost savings, a clear return on even a substantial simulation investment.
9. Maritime and Offshore: Classification Society Acceptance of Simulation
The maritime industry’s adoption of simulation-driven design has been shaped by its regulatory framework: ships and offshore structures must be certified by classification societies (DNV, Lloyd’s Register, Bureau Veritas, ABS) whose rules define the acceptable design methods. Historically, class rules were based on simplified prescriptive formulas derived from empirical data. Over the past two decades, all major classification societies have developed direct calculation guidelines that permit, and in some cases require, FEA and CFD as alternatives to their prescriptive rule formulas for novel designs, large vessels, and complex structural details.
The primary simulation applications are hull structural FEA for global and local strength under sea loads (wave bending moments, sloshing in tanks, slamming on the bow and bottom), hydrodynamic CFD for resistance and propulsion efficiency (hull form optimization for fuel consumption), fatigue analysis of structural details (brackets, web frames, hatch corners) under wave-induced cyclic loads, mooring system dynamics for offshore floating structures, and noise and vibration analysis for passenger vessels and naval ships.
Hull Form Optimization: CFD for Fuel Efficiency
Ship fuel consumption is the largest operating cost for most commercial vessels, representing 40 to 60 percent of total operating cost. A 5 percent improvement in hull resistance, achievable through CFD-optimized hull form design, translates directly to a 5 percent reduction in fuel consumption. For a large container ship consuming 150 tonnes of fuel per day at $600 per tonne, a 5 percent saving is $4,500 per day or $1.6 million per year per vessel.
CFD hull form optimization replaces or supplements physical towing tank testing, which costs $50,000 to $200,000 per hull variant tested. A CFD optimization study can evaluate 50 to 200 hull variants in the time and cost that a physical towing tank program could evaluate 5 to 10. The hull form that emerges from a CFD optimization program is consistently better than what physical testing alone would find, because the much larger design space explored by CFD identifies optimum forms that physical testing’s narrower sampling would miss.
10. Pharmaceutical and Chemical Processing: CFD for Scale-Up and Safety
The pharmaceutical and chemical processing industries have been slower to adopt simulation-driven design than manufacturing industries, but adoption is accelerating as the complexity and regulatory scrutiny of process equipment increases. The primary driver is process scale-up risk: a batch process that works perfectly in a 50-liter laboratory reactor may fail, through inadequate mixing, poor heat removal, unexpected reaction byproducts, or thermal runaway risk, when scaled to a 10,000-liter production vessel. Physical scale-up trials are expensive, time-consuming, and in the case of hazardous reactions, potentially dangerous. CFD simulation of the reactor fluid dynamics, heat transfer, and mixing at full production scale de-risks the scale-up before the first production batch is attempted.
The primary simulation types are CFD for mixing and mass transfer in stirred tank reactors, heat transfer CFD for jacketed vessels and heat exchangers, pressure vessel FEA for process equipment structural integrity per ASME Section VIII, piping stress analysis per ASME B31.3, and explosion and consequence modeling for process hazard analysis (Gaussian dispersion modeling, blast overpressure prediction for facility layout).
Continuous Manufacturing and the FDA’s Process Analytical Technology Initiative
The FDA’s Process Analytical Technology (PAT) framework and Quality by Design (QbD) initiative have created a regulatory incentive for simulation in pharmaceutical manufacturing. Under QbD, manufacturers are encouraged to use mechanistic models, including CFD and FEA, to demonstrate understanding of the design space of their manufacturing process: how process parameters affect product quality attributes. A QbD submission supported by simulation models typically receives faster FDA review and allows greater manufacturing flexibility post-approval than a traditional empirical submission, because the simulation demonstrates that the manufacturer understands the process at a fundamental level rather than just having observed it empirically.
Frequently Asked Questions
Q: Which industry benefits most from simulation-driven design?
Aerospace and automotive are typically considered the highest-maturity and highest-volume users of simulation-driven design, but ‘most benefit’ depends on the metric. Aerospace has the highest regulatory integration, simulation is mandatory for certification. Automotive runs the highest simulation volume, major OEMs run hundreds of thousands of analyses per vehicle program. Medical devices have the highest regulatory leverage, simulation evidence can substitute for physical testing in FDA submissions. Oil and gas has the highest per-incident ROI, simulation preventing a single platform failure or pipeline rupture can save billions. The correct answer is industry-specific: simulation delivers its highest return wherever physical testing is most expensive, most time-consuming, most dangerous, or most regulated.
Q: How does simulation-driven design reduce prototype costs?
Simulation reduces prototype costs by identifying design problems before hardware is built, allowing engineers to evaluate dozens or hundreds of design variants digitally in the time and cost it would take to build and test one physical prototype.
cost asymmetry is large: a CFD simulation of a heat exchanger design costs a few hundred dollars in compute time and engineer hours; a physical prototype of the same heat exchanger costs $10,000 to $100,000 in materials, manufacturing, and test setup. Every design iteration that simulation handles, every geometry variant evaluated, every load case checked, every failure mode explored, is an iteration that does not require a physical build-and-test cycle. In mature simulation users, this translates to 40 to 70 percent fewer physical prototypes over the full product development program.
Q: Can simulation replace physical testing entirely?
No, and the goal of simulation-driven design is not to eliminate physical testing, it is to maximize the value of physical testing by using simulation to arrive at a better design before the first physical test. Physical testing validates simulation models, certifies final designs to regulatory standards, identifies failure modes that simulation did not predict, and provides the empirical data that makes simulation credible.
The appropriate relationship between simulation and testing is complementary: simulation explores the design space rapidly and cheaply, and physical testing validates the final design and the simulation itself. In the most mature industries (aerospace, automotive), regulatory frameworks explicitly define what simulation can replace (some physical test iterations in development) and what it cannot replace (final certification tests required by safety regulations).
Q: What is the ROI of simulation software investment?
Organizations that integrate simulation early into product development commonly report lower prototype costs, fewer design iterations, faster engineering cycles, and improved product quality. Lifecycle Insights has reported that organizations with mature digital engineering practices require fewer physical prototypes while improving project performance and profitability. The actual financial return depends on the industry, product complexity, regulatory requirements, and the cost of physical testing.
Q: How is simulation used in medical device FDA submissions?
The FDA accepts computational modeling and simulation (CM&S) results as part of premarket submissions (510(k) and PMA) under guidance issued in 2016 and updated subsequently. The acceptance framework requires that the simulation model be validated against physical test data for a similar geometry and loading condition, that the validation follows the ASME V&V 40 standard for medical device simulation credibility, and that the submission clearly defines the context of use, what questions the simulation is answering and what its limitations are.
When these conditions are met, simulation results can substitute for some physical bench tests (particularly parametric design exploration tests) and support the biological and performance characterization of the device. Simulation does not replace clinical trials or the final design verification testing required by 21 CFR Part 820.
Q: What simulation types are most commonly used across industries?
Structural finite element analysis (FEA) for stress, deformation, and fatigue is the most universally used simulation type, it appears in every industry on this list. Computational fluid dynamics (CFD) is the second most common, used wherever fluid flow, heat transfer, or aerodynamics matter: automotive aerodynamics, aerospace performance, oil and gas flow assurance, pharmaceutical mixing, maritime hull design, electronics cooling, and renewable energy resource assessment.
Thermal analysis (often combined with structural FEA for thermal stress) is third, particularly critical in electronics, power generation, and aerospace. Dynamic analysis (modal, harmonic, transient) is essential in automotive NVH, aerospace flutter, rotating machinery, seismic engineering, and renewable energy fatigue. The combination of structural FEA + CFD + dynamic analysis covers the majority of simulation work across all ten industries.
Conclusion:
The pattern across all ten industries is consistent: Organizations that have integrated simulation deeply into their engineering workflow consistently report improved product quality, reduced development risk, and more efficient product development processes. This is not coincidence. Simulation-driven design gives engineering teams the ability to explore design spaces that physical testing cannot reach economically, to find failure modes before they manifest in hardware, and to optimize performance dimensions that hand calculation cannot resolve. The competitive advantage this creates compounds over time as simulation models, validation databases, and process knowledge accumulate.
The common thread across aerospace, automotive, medical devices, oil and gas, civil engineering, electronics, consumer products, renewable energy, maritime, and pharmaceutical processing is the same economic logic: physical iteration is expensive, slow, and limited in scope; digital iteration is cheap, fast, and unlimited in scope. Every industry on this list has discovered, at different times, through different forcing functions, with different regulatory contexts, that the development process built on digital-first, physical-second is superior to the prototype-first, analysis-second process it replaced. The question for any engineering organization is not whether simulation-driven design delivers value, but how quickly it can be adopted at the depth and breadth that the leading competitors have already reached.
The simulation types, the regulatory frameworks, the specific use cases, and the ROI metrics differ by industry. But the direction of travel is uniform: more simulation, earlier in the design process, integrated more tightly with the physical testing that validates it, applied to a wider range of design decisions. The industries that are ahead of this curve are setting the product performance benchmarks that the rest of their sectors must meet.
Deepen your simulation knowledge with our technical guides on FEA boundary conditions, static vs dynamic analysis, stress concentration, mesh quality, and the common errors that make simulation results unreliable.
Lifecycle Insights. ROI of Digital Transformation Benchmark Report. 2021. ↩︎
The rotating pump had been operating for six months when the mounting bracket cracked. The static stress analysis had shown a safety factor of 3.2 against yield. The material was correct, the weld quality was verified, and the static load from the pump weight was well within the bracket’s capacity. What the analysis had not captured was that the pump’s operating speed of 1,450 RPM produced a vibration frequency of 24.2 Hz, and the bracket’s first natural frequency was 26.0 Hz. The frequency ratio was 0.93, placing the excitation within the resonance amplification zone.
The actual dynamic stress at the bracket root was 4.6 times the static stress. The safety factor of 3.2 had become an effective safety factor of 0.7. This is the failure mode of inappropriate static analysis: not that the calculation is wrong, but that it answers the wrong question.
Static analysis asks: what is the stress when this load is applied slowly and held constant? Dynamic analysis asks: what is the stress when this load varies with time, and specifically what happens when the load frequency approaches the structure’s natural frequencies? For a bracket on a pump, these are completely different questions with completely different answers.
This article establishes the complete framework for choosing between static and dynamic analysis: the governing equations that define each, the Dynamic Amplification Factor that quantifies when static analysis underestimates dynamic stress, the six types of dynamic analysis and what each solves, the 12-case decision table that maps load scenarios to the correct analysis type, worked numerical examples for the frequency ratio check, and the diagnostic signs that a dynamic analysis is needed even when the initial impulse was to use static.
The Governing Equations: What Makes an Analysis Static or Dynamic
The distinction between static and dynamic analysis is mathematical before it is practical. The equation of motion for a structural system is:
M·u” + C·u’ + K·u = F(t)
where M is the mass matrix, C is the damping matrix, K is the stiffness matrix, u is the displacement vector, u’ is velocity, u” is acceleration, and F(t) is the time-varying applied force vector. This is the complete equation governing structural response under any loading condition.
Static analysis is the special case where inertia forces (M·u”) and damping forces (C·u’) are both set to zero, reducing the equation to K·u = F. This is valid when the applied load changes so slowly that the structure has time to reach equilibrium at each instant, the velocity and acceleration are negligibly small compared to the displacement. The condition for this is that the frequency of load variation is much smaller than the structure’s natural frequency: specifically, the frequency ratio f_load / f_natural must be less than approximately 0.2 to 0.3 for the static result to be within 10 percent of the dynamic result.
Dynamic analysis retains the full equation of motion. The mass matrix M represents the inertia of the structure, its resistance to acceleration. The damping matrix C represents energy dissipation through material hysteresis, friction, fluid interaction, and other mechanisms. When the load changes rapidly or oscillates at a frequency near the structure’s natural frequencies, the inertia and damping terms are no longer negligible, they can dominate the response entirely, producing stresses orders of magnitude above or below what static analysis would predict.
The Mass Matrix: Where Dynamic Analysis Begins
Building a dynamic FEA model requires one critical input that static analysis does not need: mass distribution. The mass matrix M is assembled from element mass matrices, which are computed from the material density and element volume. An error in material density, a missing mass (non-structural mass not included in the element formulation), or a concentrated mass attachment not represented in the model will shift the natural frequencies away from their true values, potentially by 10 to 30 percent, changing the frequency ratios and making the dynamic analysis results unreliable.
The two approaches to mass matrix formulation are the consistent mass matrix (derived from the same shape functions as the stiffness matrix, producing a full matrix) and the lumped mass matrix (diagonal, with mass concentrated at nodes). Consistent mass matrices are more accurate for wave propagation and higher-mode response. Lumped mass matrices are computationally cheaper and are the default in explicit dynamics solvers because they allow direct computation of acceleration without a matrix solve. For modal analysis and harmonic response where lower modes dominate, both approaches give similar results for well-meshed models.
Damping: The Parameter Engineers Most Often Get Wrong
Damping determines how large the stress amplification is at resonance and how quickly the structure settles after an impulse. In FEA, damping is almost universally specified as Rayleigh damping: C = α·M + β·K, where α (mass-proportional) and β (stiffness-proportional) are constants calibrated from a target damping ratio at one or two natural frequencies. The damping ratio ζ (zeta) at a natural frequency ω_n is: ζ = α/(2ω_n) + βω_n/2.
Typical damping ratios for engineering structures: steel structures, 1 to 2 percent (0.01 to 0.02); reinforced concrete, 3 to 7 percent; soil and foundation systems, 10 to 20 percent; rubber mounts and elastomeric isolators, 5 to 15 percent. Using the wrong damping ratio has its greatest effect at resonance: at a frequency ratio of 1.0, the Dynamic Amplification Factor is 1/(2ζ). At 1 percent damping, DAF = 50. At 5 percent damping, DAF = 10. At 10 percent damping, DAF = 5. An error in damping ratio of a factor of two changes the resonance peak stress by a factor of two, a larger sensitivity than almost any other modeling parameter in structural FEA.
The Dynamic Amplification Factor: Quantifying When Static Analysis Fails
The Dynamic Amplification Factor (DAF) is the ratio of the maximum dynamic displacement (or stress) to the static displacement (or stress) that the same load magnitude would produce if applied statically. For a single-degree-of-freedom system under harmonic excitation:
DAF = 1 / √[(1 – r²)² + (2ζr)²]
where r = f_excitation / f_natural is the frequency ratio and ζ is the damping ratio. This formula is the single most important quantitative tool for deciding whether static analysis is sufficient:
r < 0.3: DAF is between 1.0 and 1.10 for any realistic damping. Static analysis is valid, the dynamic correction is less than 10 percent, typically within the accuracy of the load specification itself.
0.3 < r < 0.7: DAF rises from 1.10 to between 1.5 and 2.5 depending on damping. Dynamic analysis is recommended. Static analysis underestimates peak stress by 50 to 150 percent in this range.
0.7 < r < 1.3 (resonance zone): DAF can reach 5 to 50 depending on damping. Static analysis is dangerously non-conservative. A structure with a safety factor of 3.0 from static analysis may have an effective safety factor below 1.0 if the frequency ratio is near 1.0.
r > 1.4 (isolation region): DAF drops below 1.0, the dynamic response is actually less than the static response. Vibration isolators operate in this region deliberately. Static analysis is conservative (overestimates stress) but dynamic analysis gives a less conservative and more accurate result.
Worked Example: Frequency Ratio Check for a Pump Bracket
A steel pump bracket has a first natural frequency of 35 Hz (from a modal analysis or hand calculation using the bracket geometry and mass). The pump operates at 1,750 RPM, producing a vibration excitation at 1750/60 = 29.2 Hz. The pump also has a blade-passing frequency of 4 blades x 29.2 Hz = 116.7 Hz.
Frequency Ratio and DAF Calculation, Pump Bracket GIVEN: Bracket first natural frequency: f_nat = 35 Hz Pump operating frequency: f_op = 1750 RPM / 60 = 29.2 Hz Blade-passing frequency: f_bp = 4 x 29.2 = 116.7 Hz Material damping ratio (steel): zeta = 0.02 (2%)
FREQUENCY RATIOS: r_operating = 29.2 / 35 = 0.834 <- RESONANCE ZONE (0.7 < r < 1.3) r_blade_pass = 116.7 / 35 = 3.33 <- Well above resonance (isolation region)
CONCLUSION: Static stress prediction is 3.27x too LOW at operating frequency. If static analysis showed safety factor = 2.5, actual dynamic SF = 2.5/3.27 = 0.76 -> Structure WILL fail at operating speed. Dynamic analysis is mandatory. -> Recommend redesign to shift f_nat above 50 Hz (r < 0.58, DAF < 1.5)
The Six Types of Dynamic Analysis: Which One to Use
Dynamic analysis is not a single method, it is a family of six distinct analysis types, each designed for a different class of dynamic loading. Choosing the wrong type is as consequential as choosing static analysis when dynamic is needed: a harmonic response analysis cannot capture the transient response to an impact, and a transient analysis is unnecessary and expensive when the excitation is steady-state sinusoidal. The following table maps each type to its use case, output, and solver approach.
Analysis Type
What It Solves
Primary Output
Typical Use Cases
Solver Approach
Modal / Natural Frequency
Undamped free-vibration: K·phi = omega^2·M·phi
Natural frequencies (Hz) and mode shapes
Finding resonant frequencies before designing excitation; validating FEA model against measured frequencies; selecting operating speeds for rotating machinery
RMS response to broadband random excitation described by Power Spectral Density
RMS displacement, stress; PSD of response; fatigue damage spectrum
Aerospace launch environment qualification; road vehicle vibration; electronic PCB under random base excitation; MIL-STD-810 testing
Modal superposition + statistical integration over PSD input spectrum
Explicit Dynamics
Large deformation, short-duration, high-velocity transient with contact and material nonlinearity
Full time history of stress, strain, deformation including plastic flow, fracture, contact impact
Crash and impact simulation; blast and ballistic analysis; metal forming; bird strike; dropped object analysis
Explicit time integration (central difference); very small time steps (~microseconds)
Modal Analysis: The Foundation of All Dynamic Analysis
Modal analysis, the computation of natural frequencies and mode shapes, is not just one type of dynamic analysis. It is the foundation on which harmonic response, response spectrum, and random vibration analyses are all built. Understanding modal analysis results is the prerequisite for interpreting every other dynamic output.
The natural frequencies ω_n (in rad/s) and mode shapes φ_n are the solutions to the eigenvalue problem: (K – ω_n²·M)φ_n = 0. Each mode shape φ_n describes the pattern of relative displacement across the structure when it vibrates at its corresponding natural frequency f_n = ω_n / (2π). The first (lowest) natural frequency is the most important: it defines the boundary between quasi-static and dynamic loading, and it is where the largest resonance amplification occurs for most realistic excitation spectra.
Modal Effective Mass: Identifying Which Modes Matter
A structure with thousands of elements has thousands of natural frequencies and mode shapes. In practice, only a small number of modes contribute significantly to the response for any given loading direction. The modal effective mass for each mode and each direction tells the analyst what fraction of the total structural mass participates in that mode’s response to a base excitation in that direction. Modes with high effective mass dominate the response; modes with low effective mass can be neglected.
The standard criterion for modal truncation: include enough modes so that the cumulative effective mass exceeds 90 percent of the total structural mass in each excitation direction. For seismic analysis, ASCE 7 and Eurocode 8 require 90 percent mass participation. For general dynamic analysis, this criterion ensures that the missing higher modes contribute less than 10 percent to the total response, typically acceptable given other modeling uncertainties. Failing to include enough modes is the most common error in modal superposition analyses, producing results that appear converged but are missing significant response contributions from higher modes.
Interpreting Mode Shapes: What They Tell You About Failure Risk
Mode shapes tell the analyst where the structure is most flexible and where stresses will be highest if that mode is excited. A mode shape with large relative displacement at a specific location (a cantilevered arm tip, a thin web between flanges, a long unsupported span) indicates that if the excitation frequency is near this mode’s natural frequency, the stress at the high-displacement locations will be amplified by the DAF. Conversely, locations that show minimal motion in the mode shape are insensitive to excitation of that mode.
The practical application: after running a modal analysis, animate the first five to ten modes and identify which structural features participate in each. Then check whether any operational excitation frequencies (rotating machinery harmonics, flow-induced vibration, traffic loading rates) fall near any of these natural frequencies. This frequency map, plotting operational excitation frequencies against structural natural frequencies, is the single most useful deliverable from a modal analysis and the primary tool for identifying resonance risk before a component enters service.
Transient vs Harmonic Analysis: Choosing the Right Dynamic Solver
When dynamic analysis is required, the next decision is whether the loading is steady-state sinusoidal (harmonic) or time-varying and non-periodic (transient). This determines whether to use harmonic response analysis or transient time-history analysis, two fundamentally different solvers with different computational requirements, output formats, and appropriate post-processing approaches.
Harmonic Response Analysis
Harmonic response analysis solves for the steady-state amplitude and phase of structural response across a range of excitation frequencies. The input is a sinusoidal force or displacement excitation of specified amplitude, and the output is how the structure responds to that excitation at each frequency, the Frequency Response Function (FRF). The analysis sweeps through a user-defined frequency range, solving for the response at each frequency point.
Harmonic response is the correct tool for: rotating machinery at known operating speeds (where the imbalance force is sinusoidal at the rotation frequency and its harmonics), acoustic excitation (where the acoustic pressure is often a known sinusoidal signal), vibration test correlation (where shake-table tests apply sinusoidal excitation), and any application where the excitation is a steady, repetitive sinusoidal signal. It is not appropriate for impact, shock, seismic, or random vibration loading, all of which require transient or spectrum-based methods.
Transient (Time History) Analysis
Transient analysis solves the full equation of motion step by step through time, computing the displacement, velocity, acceleration, and stress at each time increment. The input is a complete time history of the applied load F(t). The output is the complete time history of structural response, how the structure evolves from its initial state through the loading event.
Two approaches to transient analysis: modal superposition transient (decompose the response into modal coordinates, solve each mode’s 1-DOF equation through time, then recombine, efficient for linear problems where the modes are computed once and the time integration is inexpensive) and direct time integration (solve the full system of equations at each time step using the Newmark-beta or HHT-alpha algorithm, more expensive but required for nonlinear problems where the stiffness or mass changes during the response, such as contact opening/closing or plasticity).
The critical time step selection rule for direct transient integration: the time step must be smaller than approximately T_n/20 for the highest mode of interest, where T_n is the natural period of that mode. For a structure with a highest significant natural frequency of 100 Hz (T = 10ms), the time step must be 0.5ms or smaller. Exceeding this limit produces numerical instability or artificial damping in the Newmark method, corrupting the high-frequency response.
IMPLICIT vs EXPLICIT Time Integration: The Most Important Dynamic Solver Choice Implicit integration (Newmark-beta, HHT-alpha) solves a system of equations at each time step, stable for larger time steps but requires a matrix solve at every increment. Used for structural dynamics where the time step is governed by accuracy, not stability. Explicit integration (central difference) computes the next state directly from the current state without a matrix solve, extremely fast per step but conditionally stable: the time step must be smaller than the Courant stability limit (approximately element size / wave speed), typically microseconds for metal structures. Use implicit for structural vibration, seismic, and most transient problems. Use explicit only for very short-duration high-rate events (crash, blast, impact, metal forming) where the required time step is already in the microsecond range and the nonlinearity requires it.
The 12-Case Decision Table: Static or Dynamic?
The following table maps 12 common engineering scenarios to the correct analysis type, with the rationale for each decision. Use this table as the starting point for any new analysis setup, identify the scenario closest to the problem at hand, check the rationale, and verify with the frequency ratio calculation before committing to a static or dynamic approach.
Scenario
Load Characteristics
Recommended Analysis
Rationale
Lifting lug on a crane hook
Dead weight of lifted object; lift speed is slow
Static
Frequency ratio f_load/f_nat << 0.1; inertia forces negligible; DAF ~ 1.0
Bridge under traffic loads
Vehicles crossing at known speeds; load varies slowly relative to bridge period
Static with dynamic amplification factor (code-specified)
Bridge codes (AASHTO, Eurocode) apply DAF to static result; full dynamic only for unusual load cases
Electric motor mounting bracket
Rotating imbalance force at motor RPM frequency
Harmonic response
Steady-state sinusoidal excitation at known frequency; must check if operating frequency is near natural frequency
Pump impeller under operating loads
Centrifugal load + blade-passing frequency excitation
Modal + harmonic response
Need natural frequencies to avoid resonance, then harmonic to quantify vibration at operating and blade-pass frequencies
Drop test of electronic enclosure
Impact with ground; very short duration (milliseconds)
Explicit dynamics or transient implicit
High-rate impulsive load; inertia forces dominate; duration comparable to or shorter than structural natural period
Seismic qualification of equipment
Earthquake ground motion, broadband, random-like
Response spectrum (code) or time history transient
Seismic codes specify response spectrum method; time history used when code spectrum is not applicable or for detailed assessment
PCB under launch vibration
Broadband random vibration, PSD specification (e.g., MIL-STD-1540)
Random vibration (PSD)
Excitation is statistical; RMS stress used for fatigue life prediction; deterministic transient is not meaningful for random inputs
Pressure vessel under static internal pressure
Constant internal pressure; no cyclic component
Static
Time-invariant load; structure not vibrating; linear static is exact solution
Heat exchanger tube under flow-induced vibration
Fluid cross-flow excites vortex shedding at Strouhal frequency
Modal + harmonic or transient
Must verify that vortex shedding frequency does not coincide with tube natural frequency; lock-in risk
Crankshaft torsional vibration
Engine firing pulses at multiples of RPM frequency
Modal + harmonic (torsional)
Torsional resonances can fracture crankshafts; must map all engine order excitations against torsional natural frequencies across RPM range
Blast-loaded wall panel
Explosive pressure pulse, millisecond duration
Explicit dynamics
Extreme strain rates; large deformation and possible fracture; implicit transient is too slow and may not handle the nonlinearity
Gravity-loaded shelf structure
Self-weight + uniformly distributed load; no vibration
Static
Classic static problem; any dynamic analysis would give identical result to static at zero cost premium
Worked Examples: Static vs Dynamic Decision in Practice
Example 1: Overhead Crane Girder, Static Is Correct
An overhead crane girder spans 20 meters and carries a 10-tonne hoist. The crane travels at 0.5 m/s. Determine whether static or dynamic analysis is appropriate for the girder design check.
Natural frequency estimate: For a simply supported steel beam, f_1 = (π/2L²)√(EI/μ), where L = 20m, E = 210 GPa, I = moment of inertia of the girder section, μ = mass per unit length. For a typical crane girder with I = 0.004 m⁴ and mass 500 kg/m: f_1 ≈ 2.1 Hz.
Load frequency: The hoist travel at 0.5 m/s traverses the span in 40 seconds, corresponding to a loading frequency of approximately 1/40 = 0.025 Hz for the moving load cycle.
Frequency ratio: r = 0.025 / 2.1 = 0.012, far below 0.3. Static analysis is valid. Crane design codes (CMAA, FEM, Eurocode 3) specify dynamic load factors of 1.1 to 1.3 applied to the static load to account for the small dynamic amplification at this frequency ratio. Full dynamic analysis is not required and would produce essentially the same result as static with the code-specified dynamic factor applied.
Example 2: Compressor Skid Frame, Dynamic Analysis Required
A compressor skid frame supports a reciprocating compressor running at 750 RPM. The compressor produces primary and secondary unbalance forces at 12.5 Hz and 25 Hz respectively. A modal analysis of the skid frame shows natural frequencies at 18 Hz, 31 Hz, and 47 Hz.
Frequency ratios:
Primary force (12.5 Hz) vs first mode (18 Hz): r = 12.5/18 = 0.694, approaching resonance zone. DAF at 2% damping: approximately 2.0
Secondary force (25 Hz) vs second mode (31 Hz): r = 25/31 = 0.806, in resonance zone. DAF at 2% damping: approximately 3.6
Secondary force (25 Hz) vs first mode (18 Hz): r = 25/18 = 1.39, just above resonance, DAF approximately 0.9
Decision: Harmonic response analysis is required for all operating speed combinations. The secondary force is within the resonance zone of the second skid mode, producing a DAF of 3.6. A static analysis using only the peak unbalance force magnitude would underpredict dynamic stress by a factor of 3.6 at this condition. The skid frame design must either be stiffened to shift natural frequencies away from operating harmonics, or damping must be added to reduce the DAF at the near-resonant condition.
Example 3: Equipment Seismic Qualification, Response Spectrum
An electrical cabinet weighing 800 kg must be qualified to the seismic requirements of IEEE 693 for moderate seismic risk. The facility is located in a region where the design seismic spectrum has a peak spectral acceleration of 0.5g at 5 Hz, falling to 0.2g at 20 Hz. The cabinet’s fundamental frequency from modal analysis is 8 Hz.
Decision: Response spectrum analysis is the correct method. The seismic excitation is broadband and statistical, a single time history is not representative of all possible earthquakes. The response spectrum provided by IEEE 693 (or the site-specific spectrum from a seismic hazard analysis) captures the statistical envelope of ground motion demands across all frequencies.
Procedure: Run modal analysis to find all modes with significant effective mass (target: 90% total mass participation in each direction). Read spectral acceleration from the design spectrum at each mode’s natural frequency. Compute peak modal response for each mode. Combine modal responses using SRSS (Square Root of Sum of Squares) or CQC (Complete Quadratic Combination) depending on frequency spacing. The resulting peak stress is used for structural qualification against code-allowable limits.
Key output: At 8 Hz, the spectral acceleration is approximately 0.45g (interpolated from the spectrum). The peak seismic inertia force on the cabinet is F = m·Sa = 800 kg × 0.45 × 9.81 m/s² = 3,532 N. This force is applied at the cabinet center of mass in the modal direction to determine base shear, anchor bolt loads, and internal component stress. A static analysis using only the code-specified static coefficient (0.2g in many older codes) would underestimate the dynamic demand at the 8 Hz frequency by a factor of 2.25.
When Static Analysis Masquerades as Sufficient
The most dangerous failure mode in analysis selection is not obvious error, it is static analysis that produces plausible results for the wrong reason. Several conditions make a static analysis appear adequate even when dynamic effects are significant:
The Safety Factor Absorbs the Dynamic Amplification, Until It Doesn’t
In many design codes and company standards, safety factors of 2.0 to 3.0 are applied to static stress results. If the dynamic amplification factor is 1.5 to 2.0, the safety factor may inadvertently cover the dynamic effect, and no fatigue cracking or yielding occurs during the design life. The analysis appears validated by the absence of field failures, but it is validated by coincidence, not by analysis correctness. When the operating speed changes, the excitation changes, the damping decreases due to wear, or a slightly different component with a different natural frequency is installed, the coincidental coverage disappears and failures begin.
Operating Below Resonance, And Then Crossing Through It
A machine that operates below its resonance frequency (r < 0.7, DAF < 1.5) during normal operation passes through resonance every time it starts up or shuts down. If the run-up time is short (seconds), the structure spends little time at resonance and the peak transient amplification is limited. If the run-up time is long (minutes), the structure can build up resonance amplitude over many cycles, a phenomenon called resonance dwell that can produce stresses far exceeding the steady-state resonance peak. Machines with long coast-down times under power failure are particularly vulnerable: the speed decays slowly through the resonance zone while the structure vibrates at peak amplitude.
Low-Damping Materials at Near-Resonant Conditions
Steel and aluminum structures have inherently low material damping (0.5 to 2 percent critical damping). At frequency ratios between 0.8 and 1.2, the DAF for 1 percent damping ranges from 5 to 50. A static analysis that ignores this amplification is not conservative by a factor of 2, it is non-conservative by a factor of 5 to 50. Any steel or aluminum structure with a known excitation source at a frequency within 30 percent of any natural frequency requires dynamic analysis, regardless of the apparent static safety factor.
Frequently Asked Questions
Q: What is the frequency ratio and how do I use it to decide between static and dynamic analysis?
The frequency ratio r = f_excitation / f_natural is the ratio of the load’s frequency of variation to the structure’s first natural frequency. When r is less than 0.3, the Dynamic Amplification Factor (DAF) is within 10 percent of 1.0 for any realistic damping, and static analysis is valid. When r is between 0.3 and 0.7, the DAF rises to between 1.1 and 2.5, and dynamic analysis is recommended. When r approaches 1.0 (resonance), the DAF can reach 5 to 50 depending on damping, and static analysis is completely invalid, it underestimates peak stress by factors of 5 to 50.
To use the frequency ratio: (1) estimate or measure the structure’s first natural frequency by modal analysis or hand calculation, (2) identify all significant excitation frequencies (RPM harmonics, vortex shedding, flow pulse rates, etc.), (3) compute r for each excitation/mode pair, and (4) apply the DAF formula to quantify the amplification. If DAF exceeds 1.1 for any significant excitation, dynamic analysis is required.
Q: What is the difference between modal analysis and dynamic analysis?
Modal analysis is one specific type of dynamic analysis that computes the natural frequencies and mode shapes of a structure by solving the eigenvalue problem (K – omega^2 * M) * phi = 0. It does not compute response to any applied load, it only characterizes the free-vibration properties of the structure. Dynamic analysis is a broader term covering all analysis types that include inertia effects: modal analysis, harmonic response, transient time history, response spectrum, random vibration (PSD), and explicit dynamics. Modal analysis is typically the first step in a complete dynamic analysis workflow: run modal to find natural frequencies and mode shapes, then use those results as the basis for harmonic, response spectrum, or random vibration analyses using modal superposition.
Q: Can I use a Dynamic Amplification Factor with a static analysis instead of running a full dynamic analysis?
Yes, for many standard applications, this is exactly what building codes (ASCE 7), crane codes (CMAA, Eurocode 3), and seismic codes do when they specify a dynamic load factor or dynamic amplification factor to be applied to a static load. The approach is valid when: (1) the excitation frequency and the dominant natural frequency are both known, (2) the frequency ratio places the system in a predictable DAF region (not in the chaotic high-sensitivity zone near resonance), and (3) the code-specified DAF conservatively bounds the actual dynamic amplification for the load case.
When the frequency ratio is near 1.0, code-specified DAFs are no longer reliable bounds and a full dynamic analysis is required to determine the actual amplification. Also note that DAF-amplified static analysis cannot predict resonance, mode shape effects on stress distribution, or transient build-up phenomena, it only adjusts the magnitude of the static load.
Q: What is explicit dynamics and when does it replace implicit transient analysis?
Explicit dynamics uses the central difference time integration method to step forward in time without solving a system of equations at each step, each node’s acceleration is computed directly from the forces on it, then integrated to velocity and displacement. This makes each time step very fast computationally, but the method is only conditionally stable: the time step must be smaller than the Courant stability limit, typically the element size divided by the acoustic wave speed in the material (microseconds for steel).
Q: Why does my static FEA agree with my hand calculation but my test shows three times higher stress?
This is the signature of an unidentified dynamic effect. When static FEA and analytical statics agree but physical testing shows much higher stress, the most likely cause is that the test excitation frequency is near a natural frequency of the structure, producing resonance amplification that neither the static FEA nor the hand calculation can capture.
Q: How many modes do I need to include in a modal superposition analysis?
Include enough modes so that the cumulative modal effective mass exceeds 90 percent of the total structural mass in each excitation direction. This is the minimum requirement specified by seismic codes (ASCE 7, Eurocode 8) and is a reasonable criterion for general dynamic analysis. In practice, this typically requires 10 to 50 modes for typical industrial structures, more for complex structures with distributed mass.
Conclusion:
Static analysis is not a simplification of dynamic analysis. It is a different answer to a different question. Static analysis asks what the stress is under a constant, equilibrium load. Dynamic analysis asks what the stress is when the load varies with time and when the structure’s inertia and natural frequencies determine how it responds. For slowly applied loads far below the first natural frequency, these questions have the same answer. For any other loading condition, they diverge, and the divergence grows without bound as the excitation frequency approaches the structural resonance.
The decision process is: calculate the frequency ratio, evaluate the DAF, and let the physics determine the analysis type. Not the software default, not the schedule pressure, not the analyst’s familiarity with static setups. A structure with a known excitation at 80 percent of its first natural frequency has a minimum DAF of 2.8 at 2 percent damping, the static safety factor must exceed 2.8 just to break even with the dynamic effect, before any structural uncertainty is accounted for. No engineering practice justifies static analysis in that condition.
The tools for making the correct decision are in this article: the governing equation that shows exactly which terms static analysis drops, the DAF formula that quantifies the error of ignoring them, the six dynamic analysis types and their appropriate load cases, the 12-case decision table, and the worked examples showing the calculation chain from operating RPM to frequency ratio to DAF to required analysis type. Apply this framework at the beginning of every analysis setup, before any model is built.
Continue your FEA knowledge with our guides on boundary condition selection, stress concentration analysis, mesh quality and convergence, linear vs nonlinear FEA, and common FEA errors that produce wrong results.
The 40-millimeter-diameter shaft that the engineer specified should have been more than adequate for the applied torque. The calculation showed it. But the shaft failed in fatigue after three months of service, and the failure initiated at the shoulder fillet where the shaft stepped down to its smaller diameter. The shoulder fillet radius was 0.5 millimeters. The torque was well within the material’s endurance limit. The stress concentration at that 0.5mm radius was not.
This is the pattern of stress concentration failure: an engineer calculates a safety factor using the nominal stress at the critical section, the factor looks adequate, and the component fails because the local peak stress at the geometric discontinuity was never considered. The nominal stress is the average stress across the net cross-section. The actual peak stress at a notch, hole, fillet, or groove is a multiple of that nominal: for a small-radius fillet on a large shoulder, that multiple can exceed 3 or 4, consuming the entire safety factor and putting the local stress into the fatigue damage regime even when the nominal stress calculation suggests otherwise.
Stress concentration analysis is the engineering discipline of quantifying this peak-to-nominal stress ratio, understanding what governs it, and designing to control it. This article covers the complete framework: the physics of stress concentration, the mathematical definitions of the theoretical stress concentration factor Kt and the fatigue notch factor Kf, practical Kt values for 14 common engineering geometries, the notch sensitivity factor that connects Kt to Kf for real materials, the step-by-step workflow for extracting Kt from FEA, and the design strategies that reduce stress concentrations at the CAD stage before they become fatigue problems in service.
The Physics of Stress Concentration: Why Geometry Creates Local Peaks
Stress concentration is not a failure of the stress calculation: it is a physical reality of how elastic bodies transmit force through geometric discontinuities. To understand it intuitively, think of stress lines as analogous to streamlines in a fluid flow. When fluid flows through a uniform pipe, the streamlines are evenly distributed across the cross-section. When the pipe has a constriction, the streamlines must crowd together at the narrowest point. The velocity at the constriction is higher than in the uniform pipe: the same flow rate must pass through a smaller area.
Stress transmission in an elastic solid follows the same principle. Under uniform tensile loading, the stress is uniformly distributed across a uniform cross-section. At a geometric discontinuity, the stress lines must redirect around the discontinuity and then reconverge. The stress lines crowd together at the most constrained point of the discontinuity, producing a local peak that is higher than the average stress in the net cross-section. The ratio of this local peak to the average is the stress concentration factor Kt.
The Circular Hole in a Plate: The Exact Solution
The most important exact solution in stress concentration analysis is the Kirsch solution for an infinite plate with a circular hole under uniaxial tension. Derived by Ernst Kirsch in 1898, this solution gives the complete stress field around the hole in closed form. At the edge of the hole on the axis perpendicular to the applied load (the equator of the hole), the stress in the loading direction is exactly three times the remote stress. At the edge of the hole on the axis parallel to the load (the poles of the hole), the stress in the loading direction is compressive and equal to minus one times the remote stress (full stress reversal).
This Kt = 3 for a circular hole in an infinite plate is perhaps the single most important number in mechanical engineering fatigue design. It appears in Peterson’s Stress Concentration Factors, in every textbook on machine design, and in every FEA validation exercise for stress concentration analysis. It is exact for an infinite plate (one where the hole diameter is negligibly small compared to the plate width). As the hole diameter approaches the plate width, the finite-width correction increases Kt above 3, eventually approaching infinity as the hole fills the plate.
The Kirsch solution also shows that stress concentration is a local phenomenon: the stress elevation decays rapidly with distance from the hole. At a distance equal to one hole radius from the edge of the hole (two hole radii from the center), the stress has already returned to within 10 percent of the remote stress. This decay behavior is the basis of Saint-Venant’s principle as applied to stress concentration: the elevated stress is confined to a region approximately equal to the size of the discontinuity, and the rest of the structure is essentially unaffected by the local stress elevation.
The Elliptical Hole: How Shape Controls Kt
The exact solution for an elliptical hole in an infinite plate under uniaxial tension gives Kt = 1 + 2(a/b), where a is the semi-axis perpendicular to the applied load and b is the semi-axis parallel to the applied load. For a circular hole (a = b), this gives Kt = 1 + 2(1) = 3, recovering the Kirsch result. For an ellipse elongated perpendicular to the load (a > b, a crack-like geometry), Kt grows without bound as a/b increases. For an ellipse elongated parallel to the load (a < b, a stream-lined hole), Kt decreases below 3, approaching 1 for a very elongated ellipse aligned with the load direction.
This formula contains the entire design principle of stress concentration reduction in one equation: the ratio of the semi-axis perpendicular to the load to the semi-axis parallel to the load determines Kt. To minimize Kt for a hole in a plate under uniaxial tension, orient the hole’s long axis parallel to the loading direction. This principle explains why aircraft fuselage windows are rounded-rectangle shapes (to reduce the Kt at the corners), why keyways are given generous corner radii (to reduce the b/a ratio at the key corner), and why sharp notches and cracks are so damaging (their extreme a/b ratio produces very high Kt values).
The Theoretical Stress Concentration Factor Kt: Definition and Reference Data
The theoretical stress concentration factor Kt is defined as the ratio of the maximum local stress at a geometric discontinuity to the nominal stress at the net cross-section:
Kt = sigma_max / sigma_nom
where sigma_max is the maximum stress at the discontinuity (from elastic analysis) and sigma_nom is the nominal stress calculated at the net cross-section using standard mechanics formulas (P/A for tension, Mc/I for bending, Tc/J for torsion). The subscript t in Kt indicates theoretical: this is the ratio from linear elastic theory, which overestimates the actual fatigue stress concentration factor in ductile materials because it does not account for the material’s ability to redistribute stress locally through microplasticity. The conversion from Kt to the fatigue-relevant factor Kf requires the notch sensitivity factor, covered in the next section.
Kt Reference Values for 14 Common Geometries
Geometry
Loading
Kt Range
Key Parameter
Notes
Circular hole in infinite plate
Uniaxial tension
3.0 (exact)
d/W -> 0 (infinite plate limit)
Kt=3 is exact for infinite plate; reduces with finite width
Circular hole in finite-width plate
Uniaxial tension
3.0 to 10+
d/W ratio (hole dia/plate width)
Kt increases sharply as d/W exceeds 0.5
Elliptical hole in plate
Uniaxial tension
1 + 2(a/b)
a/b (semi-axis ratio)
a=major axis perpendicular to load; Kt=3 for circle (a=b)
Shoulder fillet (rectangular bar)
Axial tension
1.2 to 3.0
r/d and D/d ratios
r=fillet radius, d=small width, D=large width
Shoulder fillet (rectangular bar)
Bending
1.2 to 2.5
r/d and D/d ratios
Lower Kt than tension for same geometry
Shoulder fillet (circular shaft)
Axial tension
1.2 to 3.0
r/d and D/d ratios
Similar to rectangular bar in tension
Shoulder fillet (circular shaft)
Bending
1.2 to 2.5
r/d and D/d ratios
Lower Kt than tension; use Pilkey/Peterson for exact values
Shoulder fillet (circular shaft)
Torsion
1.1 to 2.0
r/d and D/d ratios
Torsion Kt always lower than bending or tension Kt
Circumferential U-groove (shaft)
Bending
1.5 to 4.0
r/d (groove radius/shaft dia)
Sharper groove = higher Kt; deep groove compounds effect
Transverse hole in round shaft
Bending
2.0 to 4.0
d_hole/D_shaft
Very sensitive to hole diameter ratio
Keyway (sled runner type)
Torsion
2.0 to 3.0
r/b (corner radius/width)
Sharp keyway corners: Kt up to 5+; add corner radii
Metric thread (M-series)
Axial tension
2.0 to 4.0
Thread pitch and root radius
Root radius r = 0.144P for M-thread; Kt from thread profile charts
Press-fit interface (shaft/hub)
Bending
1.5 to 3.0
Press fit pressure, contact length
Fretting fatigue risk; Kt highly variable with fit tolerance
T-head bolt under bearing load
Bending + tension
2.5 to 5.0
Head geometry, fillet radius
Complex stress state; FEA recommended for accuracy
Using Peterson’s Charts: What They Are and How to Read Them
The definitive reference for Kt in engineering practice is Peterson’s Stress Concentration Factors, originally published by R.E. Peterson and now in its fourth edition edited by Walter Pilkey and Deborah Pilkey (Wiley, 2020). Peterson’s charts provide Kt as a function of relevant geometric ratios for hundreds of configurations: plates with holes, shoulders and fillets, grooves and notches, keyways, threads, welds, and many other geometries that arise in mechanical design.
Each Peterson’s chart plots Kt on the vertical axis against one geometric ratio (typically r/d, where r is the root radius and d is the smaller cross-sectional dimension) with multiple curves for different values of a second geometric ratio (typically D/d for shoulder fillets, where D is the larger dimension). To use the chart for a specific geometry, determine the relevant geometric ratios from the dimensions, locate the appropriate curve, and read off the Kt value. Always verify that your geometric ratios fall within the validity range of the chart: the Pilkey edition explicitly states validity ranges, and extrapolating beyond them can introduce errors of 20 percent or more.
From Kt to Kf: Notch Sensitivity and the Fatigue Stress Concentration Factor
The theoretical stress concentration factor Kt is a geometric property. It depends only on the shape of the discontinuity, not on the material. Two components of identical geometry, one made of hardened steel and one made of rubber, have the same Kt. But they will behave very differently under cyclic loading, because the hardened steel is highly sensitive to the local peak stress while the rubber can redistribute that stress through local deformation without initiating fatigue damage.
The material’s sensitivity to stress concentrations in fatigue is captured by the notch sensitivity factor q, which ranges from 0 (completely insensitive to notches) to 1 (fully sensitive, experiencing the full theoretical stress concentration). The fatigue notch factor Kf is related to Kt and q by:
Kf = 1 + q(Kt – 1)
When q = 0: Kf = 1 (no effect of stress concentration on fatigue). When q = 1: Kf = Kt (full theoretical concentration applies). For most engineering materials, q lies between these extremes and depends on the material’s ultimate tensile strength, the notch root radius, and the notch geometry. Higher-strength materials have higher notch sensitivity: a hardened tool steel near its endurance limit will experience close to the full Kt effect at a notch, while a mild steel will experience perhaps 80 percent of Kt at the same notch geometry.
The Neuber Constant and Notch Sensitivity Calculation
The quantitative relationship between notch root radius r and notch sensitivity q is given by the Neuber equation
q = 1 / (1 + sqrt(a/r))
where r is the notch root radius in millimeters and a is the Neuber constant, a material property with units of length that characterizes the material’s sensitivity to stress gradients. The Neuber constant is determined from fatigue test data comparing notched and unnotched specimens. For common engineering materials:
Material / Condition
Neuber Constant ‘a’ (mm)
Notch Sensitivity q at r=1mm
Notch Sensitivity q at r=5mm
Practical Implication
Annealed or normalized steel (Sut ~400-600 MPa)
0.25
0.80
0.95
High notch sensitivity; design with generous fillets
Quenched & tempered steel (Sut ~700-1000 MPa)
0.064
0.94
0.99
Very high sensitivity; Kf approaches Kt; fillet radius critical
Moderate sensitivity; less critical than high-strength steel
Cast iron (gray)
2.5
0.29
0.67
Low sensitivity; inherent porosity already acts as stress concentrator
Mild steel (annealed, Sut ~400 MPa)
0.25
0.80
0.95
Common structural steel; notch sensitivity substantial
Titanium alloys (Sut ~800-1200 MPa)
0.10-0.25
0.85-0.95
0.97-0.99
High sensitivity similar to Q&T steel; fatigue critical
Worked Example: Calculating Kf for a Shoulder Fillet
A quenched and tempered steel shaft (Sut = 800 MPa) has a shoulder fillet with r = 2mm, small diameter d = 30mm, large diameter D = 40mm. The shaft is subject to bending. Determine Kf.
Find Kt from geometry: r/d = 2/30 = 0.067; D/d = 40/30 = 1.33. From Peterson’s chart for shoulder fillet in bending: Kt approximately 1.85
Find Neuber constant for Q&T steel at Sut = 800 MPa: a = 0.064 mm (from table above or Shigley’s/Peterson’s chart for a vs Sut)
The fatigue notch factor Kf = 1.72 is the factor to apply to the nominal bending stress when computing the fatigue safety factor or performing a stress-life (S-N) analysis. The nominal endurance limit of the material is divided by Kf (and other fatigue modifying factors) to give the component endurance limit at this location. Using Kt = 1.85 instead of Kf = 1.72 would give a more conservative result (about 8% additional conservatism), which is acceptable and is the safer choice when q is uncertain
Extracting Kt From FEA: The Workflow That Bypasses Peterson’s Charts
For complex geometries where no Peterson’s chart exists, or where the geometry falls outside the validity range of existing charts, FEA provides a direct method for computing Kt. A converged elastic FEA model of a notched geometry directly computes Kt as the ratio of the peak stress to the nominal stress, without requiring any chart lookup or geometric approximation. The accuracy of the FEA-derived Kt depends entirely on the mesh quality at the notch root, as described in the mesh quality article in this series.
The FEA-Based Kt Extraction Protocol
Build the geometry with the notch explicitly modeled: Do not approximate the fillet or notch geometry. The actual radius must be correctly represented in the CAD model. Errors in fillet radius of even 20 percent can change Kt by 10 to 20 percent.
Apply linear elastic material: Kt is defined for elastic behavior only. Use a linear elastic material model. Do not apply plasticity at this stage.
Apply consistent loading and boundary conditions: The nominal stress sigma_nom must be clearly defined. For tension Kt, apply a uniform remote stress and measure the nominal stress at the net cross-section (P/A). For bending Kt, apply a moment and measure the nominal bending stress at the net cross-section (Mc/I).
Achieve mesh convergence at the notch root: The stress peak at the notch root is a steep gradient region. Run a mesh convergence study specifically at the notch root, refining the mesh until the peak stress changes by less than 2 percent between successive refinements. The first mesh level should have at least 4 to 6 elements spanning the fillet radius circumferentially. Convergence often requires 10 to 20 elements spanning the radius.
Extract sigma_max from unaveraged nodal stress: At the converged mesh, extract the maximum principal stress (not von Mises) at the notch root using unaveraged nodal values. Von Mises stress averages the effect of multiple stress components; for Kt in uniaxial loading, the maximum principal stress at the loaded surface is the correct quantity.
Calculate Kt: Kt = sigma_max / sigma_nom. The sigma_nom is the stress from the standard mechanics formula at the net section, computed independently of FEA (P/A, Mc/I, Tc/J as applicable). Do not use the FEA-predicted stress far from the notch as sigma_nom: use the analytical nominal stress formula.
Verify against Peterson’s chart if available: For standard geometries (circular hole, shoulder fillet, U-notch), compare the FEA-derived Kt against the Peterson’s chart value for the same geometric ratios. Agreement within 5 percent confirms that the FEA mesh and extraction method are correct.
FEA Kt Extraction: Worked Numerical Example PROBLEM: Circular hole (r = 5mm) in a plate (W = 50mm wide, t = 10mm thick) under remote tensile stress sigma_remote = 100 MPa d/W = 10/50 = 0.2 (finite width effect applies)
STEP 1: Analytical sigma_nom at net section Net area = (W - d) x t = (50 - 10) x 10 = 400 mm^2 Applied force F = sigma_remote x W x t = 100 x 50 x 10 = 50,000 N sigma_nom = F / Net_area = 50,000 / 400 = 125 MPa
STEP 2: FEA setup Material: E = 210,000 MPa (steel), nu = 0.3, linear elastic Mesh: quadratic quad elements, 16 elements around hole circumference Mesh convergence: run at 8, 16, 32 elements; peak stress converges at 16 Peak sigma_max (max principal, unaveraged): 362 MPa at hole equator
STEP 4: Verification Peterson's finite-width correction for d/W = 0.2 gives Kt approx 2.88-3.00 FEA result (2.90) agrees within 0.7% -> mesh and method are correct
STEP 5: Kf for Q&T steel (Sut = 800 MPa, r = 5mm) a = 0.064 mm (from table); q = 1 / (1 + sqrt(0.064/5)) = 0.988 Kf = 1 + 0.988(2.90-1) = 1 + 0.988 x 1.90 = 1 + 1.877 = 2.88 -> High-strength steel: Kf nearly equals Kt for this notch radius
Stress Concentration in Fatigue Design: Applying Kf to Endurance Limit Calculations
In fatigue design, Kf appears as a modifier to the material’s nominal endurance limit. The modified endurance limit Se for a component at a specific notch location is:
Se = ka x kb x kc x kd x ke x (Se’ / Kf)
where Se’ is the material’s rotating-beam endurance limit (approximately 0.5 Sut for steels up to Sut = 1400 MPa, with decreasing ratio above this), ka is the surface finish factor, kb is the size factor, kc is the reliability factor, kd is the temperature factor, ke is any additional modifying factor, and Kf appears in the denominator as a strength reduction factor at the notch location
The Three Locations That Govern Fatigue Life in Shafts
In rotating shaft design, experience and research consistently identify three locations that most commonly initiate fatigue cracks: shoulder fillets, keyways, and press-fit interfaces. Understanding the Kf at each location determines which governs the fatigue design and where the analyst should focus geometry optimization.
A typical step-down shaft under combined bending and torsion will have the highest Kf at the shoulder fillet if the fillet radius is small (r/d < 0.05), at the keyway corner if the keyway has sharp corners (Kf up to 3.0 to 4.0 for sled-runner keyways), or at the press-fit edge if a gear or bearing hub is pressed onto the shaft (Kf from fretting fatigue effects). The engineer must calculate Kf at each of these three locations and design the fillet radii, keyway geometry, and press-fit stresses to keep the most critical Kf within the fatigue design target
Stress Concentration in Thread Connections
Threads represent a particularly important and often underestimated source of stress concentration. The thread root is a circumferential notch with a root radius determined by the thread standard: for standard metric M-threads, the root radius is approximately r = 0.144P, where P is the thread pitch. For an M8x1.25 bolt, the root radius is approximately 0.144 x 1.25 = 0.18mm. This very small radius, combined with the large step ratio at the thread root geometry, produces Kt values of 2.0 to 4.0 for threaded connections in tension
The location of highest stress in a bolt connection is almost always at the first engaged thread in the nut or tapped hole, where the applied tension load is highest and the thread-to-thread load distribution concentrates approximately 40 percent of the total load in the first thread. Combined with the thread root Kt, this makes the first-thread root the fatigue-critical location in virtually every bolt connection. Thread run-out, where the thread terminates at the shank, is the second critical location.
Reducing Stress Concentrations: Design Strategies at the CAD Stage
Stress concentrations are a design problem that is best solved at the CAD modeling stage, before geometry is committed to tooling. The following strategies reduce Kt and Kf at specific geometric features, with specific design guidelines that can be applied directly in the CAD environment.
Increasing Fillet Radii: The Most Effective and Simplest Strategy
The most direct way to reduce Kt at a shoulder fillet is to increase the fillet radius. The relationship between r/d and Kt is highly nonlinear: increasing r/d from 0.02 to 0.10 (a 5x increase in fillet radius) typically reduces Kt by 30 to 50 percent. Increasing r/d from 0.10 to 0.20 gives a further reduction of 10 to 20 percent. The largest proportional gains come from escaping the very small radius region (r/d < 0.05) where Kt rises sharply as the radius approaches zero.
The practical design target: r/d >= 0.10 for Kt below 2.0 for most shoulder fillet geometries. Where the design space allows, targeting r/d >= 0.20 achieves Kt below 1.5 for most fillet configurations. This corresponds to a fatigue life improvement of roughly 2 to 4 times compared to a tight fillet at r/d = 0.02 in high-strength steel, which has near-full notch sensitivity.
The Multiple Radius and Undercutting Approach
When the step in a shaft cannot accommodate a large fillet radius (because the shoulder face must be perpendicular and the transition distance is limited), two alternative geometric strategies reduce Kt without requiring a larger transition zone: multiple radius fillets and undercut grooves
A multiple radius fillet (sometimes called a compound fillet or Gough-Bell fillet) uses two or more radii blending together to transition from the small to the large shaft diameter. The smaller radius blends the geometry near the shoulder face, and the larger radius transitions the remaining step. The compound fillet achieves lower Kt than either radius alone because the stress flow lines are more gently redirected. The design is slightly more complex to machine but is standard practice in high-cycle fatigue applications such as crankshafts and turbine shafts.
An undercut groove (relief groove) is a small circumferential groove cut adjacent to the shoulder, parallel to the axis. This moves the stress concentration away from the shoulder face (where the contact stress from the bearing or hub adds to the bending stress) and provides a relief path for the stress flow. The undercut Kt is typically 10 to 20 percent lower than the equivalent shoulder fillet Kt and can be cut to a larger radius than the shoulder fillet because it is not constrained by the step height.
Drilling Adjacent Relief Holes for Keyways
The keyway corner is one of the most stress-concentrated regions in shaft design, with Kf values up to 3.0 to 5.0 for sharp sled-runner keyways. A particularly effective and practical reduction strategy is to drill small relief holes at the ends of the keyway, at the locations where the stress concentration is highest. The relief holes remove material exactly where the stress is highest, which seems counterintuitive, but the holes replace a sharp 90-degree internal corner with a smooth circular arc, which has dramatically lower Kt than the sharp corner.
Peterson’s data for keyways with end relief holes shows Kt reductions of 30 to 50 percent compared to sled-runner keyways without relief. The relief hole diameter is typically 0.5 to 1.0 times the keyway width. This approach is standard in power transmission shaft design for high-cycle applications.
Frequently Asked Questions
Q: What is a stress concentration factor (Kt)?
The stress concentration factor Kt is the ratio of the maximum local stress at a geometric discontinuity (hole, notch, fillet, groove) to the nominal stress at the net cross-section calculated by standard mechanics formulas (P/A for tension, Mc/I for bending, Tc/J for torsion). Kt is a dimensionless geometric factor that depends only on the shape of the discontinuity, not on the material or the load magnitude. For a circular hole in an infinite plate under uniaxial tension, Kt = 3 exactly (Kirsch solution). For sharp notches, Kt can exceed 5 to 10. Kt is used in fatigue analysis by converting it to the fatigue notch factor Kf through the notch sensitivity factor.
Q: What is the difference between Kt and Kf?
Kt (theoretical stress concentration factor) is purely geometric: it is the ratio of peak to nominal stress from linear elastic theory and depends only on the geometry of the notch. Kf (fatigue notch factor) is the ratio that actually reduces the fatigue endurance limit in practice. It accounts for the fact that ductile materials can partially redistribute stress at notch roots through microplasticity, reducing the effective stress concentration below the theoretical maximum. Kf is related to Kt by Kf = 1 + q(Kt-1), where q is the notch sensitivity factor (0 for no sensitivity, 1 for full sensitivity). For high-strength steels, q approaches 1 and Kf approaches Kt. For cast iron, q is close to 0 and Kf approaches 1.
Q: How do I find the stress concentration factor for a fillet or notch?
For standard geometries (shoulder fillets, circular holes, U-notches, keyways, threads), look up Kt in Peterson’s Stress Concentration Factors (Pilkey and Pilkey, Wiley) using the relevant geometric ratios: r/d (fillet radius to smaller dimension), D/d (larger to smaller dimension), d/W (hole diameter to plate width). For complex or non-standard geometries, build a converged linear elastic FEA model, apply the appropriate loading, extract the peak maximum principal stress at the notch root from unaveraged nodal values, and calculate Kt = sigma_max / sigma_nom where sigma_nom is computed from the standard mechanics formula (not from FEA far from the notch).
Q: What is notch sensitivity and why does it matter for fatigue?
Notch sensitivity q describes how strongly a material responds to stress concentrations in fatigue. A material with q = 1 (fully sensitive) experiences the full theoretical Kt at a notch, meaning every unit of stress concentration is fully effective in reducing fatigue life. A material with q = 0 (insensitive) is unaffected by notches, because it redistributes local stress through plastic deformation faster than fatigue damage accumulates. Notch sensitivity depends on material strength (higher strength = higher q) and notch root radius (larger radius = higher q). High-strength steels have q near 1.0 for most practical fillet radii, meaning they are maximally sensitive to notches. Mild steel has q around 0.8-0.9. Cast iron has q around 0.2-0.3.
Q: Can FEA be used to calculate stress concentration factors?
Yes. A converged linear elastic FEA model of a notched geometry directly computes Kt as the ratio of the peak maximum principal stress at the notch root (extracted as unaveraged nodal stress) to the nominal stress at the net cross-section (computed from the standard mechanics formula P/A, Mc/I, or Tc/J). FEA Kt is accurate when: the mesh is converged at the notch root (typically requiring 10-20 elements spanning the fillet radius), the material is linear elastic, and the peak stress is extracted from unaveraged values. FEA-derived Kt is particularly valuable for complex geometries where no Peterson’s chart exists, but the user must verify against Peterson’s data for standard geometries to confirm the extraction method is correct.
Q: How do I reduce stress concentration in a shaft design?
The most effective strategies are: (1) Increase the fillet radius at shoulder transitions to r/d >= 0.10 (achieves Kt below 2.0 for most fillet geometries) or r/d >= 0.20 (Kt below 1.5). (2) Use a multiple-radius fillet (compound fillet) when the transition distance is limited. (3) Add a relief groove adjacent to a shoulder where bearing or hub contact adds bending stress. (4) Drill relief holes at keyway ends to replace sharp corners with smooth arcs, reducing keyway Kt by 30-50%. (5) Use thread run-out relief at thread terminations. (6) Avoid sharp internal corners in all geometries: any corner with r/d less than 0.02 will have Kt above 3.0 for most geometries.
Conclusion:
Every geometric feature in a mechanical component that involves a change of cross-section, a hole, a groove, a keyway, a thread, or an abrupt transition is a potential stress concentration. In components subject to cyclic loading, these concentrations are the primary factor governing fatigue life, often more important than the nominal stress level or the material selection.
The engineer who understands stress concentration analysis has a tool that others who simply check nominal safety factors do not: the ability to predict where fatigue failures will initiate, estimate how much they will reduce fatigue life, and redesign the geometry at the CAD stage to prevent them. Every decision about fillet radius, every keyway geometry specification, every thread pitch selection, and every shoulder step ratio is a decision about Kf. Making these decisions consciously, with Kt values and notch sensitivity factors in hand, is what separates fatigue-resistant design from design that discovers its fatigue weakness in service.
The tools for doing this correctly are in this article: the Kt reference table for 14 common geometries, the notch sensitivity table for seven material classes, the worked example for converting Kt to Kf, the FEA extraction protocol for complex geometries, and the design guidelines for reducing stress concentrations in fillets, keyways, threads, and grooves. Apply them at the CAD stage, before tooling is committed, while the geometry can still be changed without cost.
Continue building your engineering analysis knowledge with our guides on FEA validation methods, common FEA errors, mesh quality and accuracy, and the complete workflow from CAD design to manufacturing-ready parts.
The FEA model runs. The solver converges without warnings. The results are presented to the design team, the safety factor looks adequate, and the design is approved. Six months later, during testing or worse, during service, something fails in a way that the analysis did not predict. The investigation that follows invariably finds one or more of the same categories of error that appear in this article, committed during the analysis phase and not detected before the decision was made.
What makes FEA errors particularly dangerous is not that they are hard to understand once identified. It is that many of them produce results that look entirely plausible. The stress contour map has smooth gradients. The deformed shape looks reasonable. The solver did not report any errors or warnings. The peak stress is in a location that makes intuitive sense. The only problem is that the actual stress is three times higher, or the failure mode is entirely different, or the model is six times stiffer than reality because of an over-constraining boundary condition that was never questioned.
This article covers 16 specific FEA errors organized into six categories, each explained with the root cause that produces it, the magnitude and type of result error it causes, and the specific detection method that will catch it before it leads to a wrong engineering decision. The goal is not just to document mistakes but to give engineers the diagnostic toolkit to find and correct them systematically.
Error Overview: 16 Mistakes Mapped to Impact and Detection
The following table maps all 16 errors covered in this article to their typical result impact, detection method, and severity. Use it as a quick reference during model review, and refer to the detailed sections for each error category for the full technical explanation.
Error Category
Specific Error
Typical Impact on Results
Detection Method
Severity
Unit system
Mixing mm and m, N and kN in same model
Factor of 1000 to 1,000,000 error on stresses
Reaction force check vs expected; dimensional sanity check
Critical – always catastrophic
Boundary conditions
Over-constraining with fixed wall instead of pin
50-500% stiffness overestimation in bending
Deformation mode review; compare reaction moments vs applied
High – systematic error
Boundary conditions
Under-constraining – rigid body motion
Solver failure or near-singular matrix
Modal analysis with 6 zero-frequency modes expected
Critical – analysis is invalid
Boundary conditions
Artificial stiffness from enforced displacement on unintended DOF
Local stress artifacts near constraint; global stiffness wrong
Remove constraint and observe deformation change
High
Material properties
Wrong Young’s modulus (10x too high/low)
Displacements off by 10x; stress unchanged if load-controlled
Verify against published data; check material units
High
Material properties
Linear material used beyond yield
Predicted stress above Sy with no yielding shown
Check peak von Mises vs Sy; run with elastoplastic model
Very High – unsafe
Material properties
Unit system error in material (GPa vs MPa)
1000x error on stress; displacement changes by 1000x
Sanity check displacement magnitude vs expected
Critical
Connection
Bonded instead of frictional contact
Artificially high force transfer; no sliding captured
Check contact pressure distribution; sliding in physical test?
High
Connection
Disconnected mesh nodes at part interface
Load not transferred; stress concentration at gap
Plot deformed shape; check force transfer through interface
Critical – load path wrong
Mesh
Coarse mesh at stress concentration
Peak stress underestimated by 50-90%
Mesh convergence study at concentration
High
Mesh
Linear tet in bending-dominated region
Bending stiffness 2-5x too high; stress wrong
Switch to quadratic tet; re-run and compare
High
Loads
Wrong load direction (global vs local coordinates)
Completely wrong deformation mode
Deformation mode check; verify against expected
Critical – completely wrong
Loads
Load magnitude in wrong unit (N vs kN)
1000x error on all stresses
Equilibrium check; compare reaction to applied
Critical
Analysis type
Linear used for geometric nonlinear problem
Stiffness wrong; snap-through missed
Check displacement/dimension ratio; run NL and compare
High
Post-processing
Reading averaged instead of unaveraged stress
Peak stress artificially reduced by averaging
Switch to unaveraged; check gradient across element
High – masks failure risk
Post-processing
Von Mises instead of principal for brittle failure
Wrong failure criterion applied
Check failure mode; use max principal for brittle
High
The severity classification reflects the potential for the error to lead to an engineering decision that would be different if the model were correct. Critical errors produce results so wrong that no engineering decision made from them should be trusted. High errors produce systematically biased results that may lead to unconservative or over-conservative decisions. The most dangerous errors are those that produce plausible-looking results that do not trigger the analyst’s suspicion.
Error Category 1: Unit System Inconsistency
Unit system errors are the most catastrophically damaging FEA mistakes because they produce errors by factors of 1,000, 1,000,000, or more, in results that look entirely reasonable in magnitude because the analyst has no independent reference for what the correct answer should be. A unit system error is a silent multiplier that scales every result in the model by a constant factor without triggering any solver warning, any convergence issue, or any plausibility check that is not deliberately applied by the analyst.
How Unit System Errors Happen
FEA solvers do not have a built-in unit system. They process numbers. The solver does not know whether the number 210,000 you entered as Young’s modulus represents 210,000 MPa (correct for steel in MPa units) or 210,000 Pa (steel modulus 1,000,000 times too low) or 210,000 GPa (steel modulus 1,000 times too high). The solver accepts whatever numbers you provide and produces results in the same unit system those numbers imply. If you enter modulus in MPa, forces in N, and geometry in mm, the solver returns stresses in MPa and displacements in mm. If you mix these units, the results are in whatever undefined mixed unit system your inputs created.
The most common mixing error: geometry imported from a CAD system in millimeters, forces applied in kilonewtons (as copied from a load specification), and Young’s modulus entered in GPa (from a materials datasheet that uses GPa). The solver receives: geometry in mm, forces in kN, modulus in GPa. It computes stresses in GPa·kN/mm^2, which is not a standard unit, and the result is numerically somewhere between 10^3 and 10^6 times the correct stress value depending on the specific combination. The displacement result has the same problem. The contour plot still looks smooth and plausible because the color scale adjusts to whatever range the results happen to cover.
The Detection Method: Four Mandatory Unit Checks
Consistent unit table before any model is started: write out your unit system explicitly before beginning. For SI: force in N, length in m, stress in Pa. For SI-mm: force in N, length in mm, stress in MPa. For US customary: force in lbf, length in in, stress in psi. Every input to the model must be in this system.
Dimensional sanity check on displacements: run a quick estimate of the expected displacement before reviewing FEA results. A steel cantilever beam 200mm long, 10mm square, loaded with 10N at the tip should deflect approximately 5mm by beam theory. If your FEA shows 0.005mm or 5000mm, you have a unit error.
Equilibrium check on reactions: the reaction forces at your boundary conditions must sum to the applied loads. If you applied 1000N and the solver reports a 1.0N reaction, your forces are in kN but you entered them expecting N.
Stress sanity check: the peak stress should be in a physically plausible range. For steel with 10N applied to a 10mm square bar (cross-section area 100mm^2), the nominal stress is 0.1 MPa. If your FEA shows 100 GPa, there is a unit error in the material or load.
Unit System Reference Card SI-mm (most common for mechanical engineering): Length: mm | Force: N | Mass: tonne (1000 kg) | Time: s | Stress: MPa (N/mm^2) | Modulus: MPa | Density: tonne/mm^3 (steel: 7.85e-9) | Thermal: mm, C, W/mm.C. SI (structures/civil): Length: m | Force: N or kN | Stress: Pa or kPa | Modulus: Pa or GPa. CRITICAL: never mix mm-geometry with GPa-modulus without explicitly converting. Steel modulus in SI-mm units = 210,000 MPa, NOT 210 GPa.
Error Category 2: Boundary Condition Errors
Boundary condition errors are the most consequential modeling mistakes for structural accuracy. The boundary conditions define how the structure is supported and loaded, and an incorrect constraint fundamentally changes the structural problem being solved. No amount of mesh refinement or solver sophistication can correct for a boundary condition that does not represent the physical support condition. The mesh quality article in this series can be thought of as optimizing the numerical solution to a mathematical problem; boundary condition errors change the mathematical problem itself.
Over-Constraining: Adding Stiffness That Does Not Exist
The most common boundary condition error in structural FEA is over-constraining: applying more constraint than the physical support actually provides. The classic example is using a fixed wall (all six degrees of freedom constrained: three translations and three rotations) to represent a bolted connection where the bolts provide translational constraint but do not prevent rotation. The fixed constraint provides infinite rotational stiffness at the connection. The real bolted joint provides finite (and often low) rotational stiffness. The result: the FEA model is systematically stiffer than the real structure, producing lower deflections and potentially lower peak bending stresses than will exist in the physical part.
The quantitative impact of over-constraining depends on the structural geometry but can be substantial. For a cantilever beam of moderate slenderness ratio (length/height approximately 10:1), replacing a pin support (translational constraint, no rotational constraint) with a fixed support (full constraint) increases the structural stiffness by approximately 4 times and reduces the tip deflection by 4 times for the same applied load. The peak stress location also shifts from the constraint location to the mid-span in some load cases. A design decision made on fixed-support FEA results for a pin-supported real structure may be unconservative by this factor.
Under-Constraining: Rigid Body Motion
The opposite error, under-constraining, produces an ill-conditioned or singular stiffness matrix that the solver cannot invert. The symptom is either a solver error (negative pivot, singular matrix, rigid body motion detected) or, in some solvers with soft springs for stabilization enabled by default, extremely large displacements that indicate unconstrained motion. Under-constraining typically happens when a model is intended to be symmetric but the symmetry boundary conditions are not correctly applied, when a part is connected to adjacent structure through contact only and the contact has not yet engaged, or when the analyst is modeling a sub-structure and has not fully defined the interface with the surrounding structure.
Detection is straightforward: run a modal analysis (natural frequency extraction) on the model before the static analysis. An unconstrained model will show six rigid body modes at or near zero frequency (three translations and three rotations with zero elastic stiffness). Each unconstrained DOF in the model corresponds to one zero-frequency mode. The mode shapes of the zero-frequency modes directly identify which translations and rotations are unconstrained, pointing to the specific missing boundary conditions.
Artificial Stiffness from Constraint Location and Type
A subtler constraint error that produces locally incorrect results without making the global analysis obviously wrong is applying displacement constraints directly to mesh nodes that are on or adjacent to the region of engineering interest. A fully fixed node creates a stress concentration artifact at the constraint location that is entirely a modeling artifact, not a real physical feature. The reported stress at and near the fixed node is meaningless, and if the stress concentration from the constraint overlaps with the real stress concentration from the geometry, the analyst cannot easily separate the physical and artificial contributions to the peak stress.
The correct approach for any support condition that is not literally a fully fixed rigid wall is to apply constraints through remote points, rigid elements, or multi-point constraints (MPC) that distribute the constraint over a realistic contact area, or to replace the support with a spring element calibrated to the actual support stiffness. This separates the constraint mechanism from the geometry of interest and prevents the artificial stress concentration artifact at the constraint location.
Boundary Condition Best Practice Before applying any constraint, ask: What physical mechanism provides this support in the real structure? A bolted joint provides translational stiffness and partial rotational stiffness, not infinite rotational stiffness. A bearing provides radial stiffness but typically not axial or moment stiffness unless specifically designed to do so. A weld provides all six DOF. Model the mechanism, not the assumption. When in doubt about the rotational stiffness: run the analysis twice, once with all six DOF fixed and once with only translational DOF fixed (pin-equivalent). The true answer lies between these bounds, and if they differ significantly, the rotational stiffness assumption is important and needs investigation.
Error Category 3: Material Property Errors
Material property errors are the category that most consistently surprises analysts because FEA software makes entering material properties feel authoritative: you type a number, the software accepts it, and the model runs. The software has no way to know whether the number you entered is correct for your material, in your unit system, at the relevant temperature, in the relevant manufacturing condition. Material property errors are therefore entirely the analyst’s responsibility to detect, and they can remain undetected through mesh convergence studies, equilibrium checks, and deformation mode reviews because these validation steps do not require correct material properties to pass.
Wrong Young’s Modulus: The Invisible Stiffness Error
An incorrect Young’s modulus shifts every displacement and stress in a load-controlled analysis by the ratio of the wrong modulus to the correct modulus. Using 210,000 Pa instead of 210,000 MPa for steel (a factor of 1,000,000 error from GPa-to-Pa confusion) produces displacements 1,000,000 times too large and reactions and stresses that appear incorrect because the structure is effectively compliant rubber rather than steel. This extreme case would be immediately obvious from a displacement sanity check.
More insidious: using 70,000 MPa (aluminum modulus) instead of 210,000 MPa (steel modulus) in a steel component, perhaps because the analyst copied material data from a previous aluminum project. The model runs correctly in every formal sense. Displacements are 3x too high (aluminum is 3x less stiff). Stresses, for a load-controlled analysis, are unchanged (stress = load/area, independent of modulus for statically determinate structures) but deflections affect the load path in statically indeterminate structures. The deformed shape looks qualitatively correct. Only a quantitative check against a hand calculation for the specific deflection catches this error.
Linear Material Beyond Yield: The Most Dangerous Material Error
Using a linear elastic material model in a situation where the true material behavior is elastoplastic is the single most dangerous material error in structural FEA because it produces results that appear to show an adequate safety factor when the real structure has actually yielded and may be near plastic collapse. A linear elastic model reports that the stress at a location is 450 MPa on a steel with a yield strength of 250 MPa. This is a physically impossible result: the real material cannot sustain 450 MPa elastically. But the solver has no knowledge of the yield strength and reports the linear elastic result without comment.
The analyst who reads 450 MPa from a linear elastic model on a 250 MPa yield-strength steel must recognize that the result cannot be the true stress. The real stress is bounded by the yield strength (in the absence of strain hardening), and the real strain is much larger than the linear analysis predicts because the material is yielding and absorbing energy that the linear model assumes is being stored elastically. For a safety assessment, any linear elastic FEA result exceeding the yield strength must be flagged and either investigated with an elastoplastic analysis or assessed using plasticity correction methods (Neuber’s rule, ESED method) specifically developed for this situation.
Temperature-Dependent Properties at Wrong Temperature
Many materials show significant changes in mechanical properties with temperature: Young’s modulus decreases, yield strength decreases, creep rate increases. An FEA analysis using room-temperature material properties for a component operating at 400 to 600 degrees Celsius, a typical turbine blade or exhaust manifold operating condition, may overestimate stiffness by 20 to 40 percent and overestimate yield strength by 50 to 70 percent compared to the actual elevated-temperature properties. The resulting safety factor is fictitious: it reflects the room-temperature material, not the material at operating temperature.
Detection requires knowing the operating temperature and verifying that the material properties in the model match published data at that temperature, not at room temperature. For thermal-structural coupled analyses, the temperature field must be correctly computed and the temperature-dependent material properties must be defined as functions of temperature in the material model, not as single values at one temperature.
Error Category 4: Connection and Contact Errors
In multi-body assemblies, the connection between parts is a modeling decision with direct consequences for load transfer, stress distribution, and overall structural stiffness. A wrong contact assumption is often worse than no contact at all, because it creates a plausible-looking stress distribution that silently transfers load in the wrong way. The most common FEA software defaults to bonded contact for all contact pairs, which means that unless the analyst explicitly changes the contact type, every touching surface in the model is assumed to be rigidly glued to every other touching surface.
Bonded Contact: When It Applies and When It Does Not
Bonded contact treats two surfaces as if they are welded or adhesively bonded with no possibility of separation, sliding, or relative displacement. It is appropriate for: welded connections (if the weld is not being analyzed for integrity), adhesive bonds that will not be stressed beyond their elastic limit, and press-fit interfaces where the contact pressure is sufficient to prevent any relative motion. It is not appropriate for: bolted connections (which can open under tension and slide under shear if the friction is overcome), bearing contacts (which can separate), snap-fit connections (which can disengage), and any interface where the contact state might change during loading.
The specific error from using bonded contact where frictionless or frictional contact is correct: the bonded interface transmits tensile force across the contact faces, which is physically impossible for surfaces that are merely in contact without adhesion. This results in artificially high load transfer across what should be a compression-only interface, changing the stress distribution in both parts and potentially masking a separation condition that would create a stress concentration in the physical assembly that the bonded model never shows.
Disconnected Mesh Nodes: The Silent Load Path Failure
In an assembly model where parts are meshed independently and then positioned in contact, it is possible for mesh nodes at the interface to be very close to each other but not actually connected. If the solver does not detect a contact pair between the surfaces (because the contact definition was omitted or the contact detection tolerance is not set wide enough to find the gap), the model treats the two surfaces as if they are in free air. No load transfers between them.
This error is particularly insidious because the model runs without error, the convergence is good, and the deformed shape may look physically reasonable on the non-loaded side. The error appears as one part moving through another in the deformed shape (interpenetration) or as a complete absence of stress in the part that should be receiving load through the contact interface. Detection: plot the deformed shape with the actual scale factor (1:1, not exaggerated) and look for interpenetration. Check that the force transferred through every interface equals the expected proportion of the applied load.
Error Category 5: Load Application Errors
Load application errors cause the analysis to solve the wrong physical problem. Unlike material errors, which affect the magnitude of results while leaving the qualitative pattern correct, load direction errors can produce a completely different deformation mode and stress distribution from the physically correct solution. A structure loaded in the Z-direction that is analyzed with the load in the X-direction (perhaps because global coordinate axes were confused with local component axes) will show maximum stress in the wrong member, maximum deflection in the wrong direction, and completely wrong reactions.
Load Direction Errors: Global vs Local Coordinates
The most common load direction error is applying a load in the global coordinate system direction when it should be in a local coordinate system direction, or vice versa. Gravity, for example, acts in the global Y (or Z, depending on the model orientation) direction. A component that is angled at 30 degrees to horizontal has gravity acting along that angle in global coordinates, but if the analyst applies gravity as a vertical downward force in global coordinates and the model is oriented with the component vertical in the model space, the load is applied in the wrong direction relative to the component geometry.
The detection method is the deformation mode check: review the deformed shape and ask whether the structure deflects in the direction you would expect given the applied load direction. If the deformation is perpendicular to the expected direction or shows a mode that does not match the loading, a load direction error is the likely cause. For models with distributed pressure loads, plot the load direction vectors as arrows on the model surface and verify they are pointing in the correct direction relative to the geometry.
Pressure Load on Wrong Surface Orientation
Surface pressure loads in FEA are applied normal to the surface element face. The direction of this normal depends on the element face orientation in the mesh. If the element normals are incorrectly oriented (pointing inward instead of outward on the external surface of a pressure vessel, for example), the pressure load is applied inward, which collapses the vessel instead of pressurizing it. This error produces a deformed shape that is immediately recognizable as wrong (inward deflection instead of outward), but only if the analyst inspects the deformed shape with a physically relevant scale factor.
Diagnostic for pressure direction errors: always plot load direction vectors before solving any pressure-loaded model. Most FEA pre-processors allow pressure direction vectors to be displayed as arrows on the mesh surface. Verify that all arrows point in the correct direction (outward for internal pressure, inward for external, always normal to the surface and in the direction the load actually acts) before running the analysis.
Error Category 6: Post-Processing and Interpretation Errors
Post-processing errors are distinct from modeling errors in one important way: the FEA model and its solution are correct, but the results are misread, misinterpreted, or presented in a way that produces wrong engineering conclusions These errors happen after the solver has finished and the results look plausible. They are entirely in the analyst’s hands and require engineering knowledge to avoid.
Averaged vs Unaveraged Stress: The Most Common Interpretation Error
When FEA computes stresses, it computes them at the integration points inside each element, then extrapolates them to the element nodes. At every node shared by multiple elements, there are therefore multiple stress values: one from each adjacent element. These values are generally different because the stress field is discontinuous across element boundaries in FEA. The FEA post-processor can either average these values (producing a smooth, continuous stress contour that artificially suppresses the discontinuity) or display them unaveraged (showing the individual element values with their true discontinuity, which is a measure of the error in the solution).
The error: reporting averaged stress at a stress concentration when unaveraged is more appropriate. Averaging smooths out the peak by mixing the high stress in the high-gradient element with the lower stress in the adjacent coarser element. The reported peak is lower than the true peak by an amount that depends on the element size at the concentration and the severity of the gradient. For a stress concentration with a physically real gradient, the averaged stress underestimates the peak. For a mesh convergence check, the difference between averaged and unaveraged is a direct measure of the mesh quality at that location: a large difference signals that the mesh is too coarse to accurately capture the gradient.
Wrong Stress Quantity for the Failure Mode
Different failure modes require different stress quantities. Using the wrong one can produce a safety factor that is wrong by more than the failure mode factor itself. The key distinctions:
Von Mises (equivalent stress): appropriate for ductile metal yielding under multiaxial stress states. The von Mises criterion predicts yielding when the distortional strain energy equals the yield strain energy. It is correct for ASME Section VIII pressure vessel analysis (Division 2 uses von Mises as the basis for the Mises yield criterion) and for most structural steel assessments.
Maximum principal stress: appropriate for brittle fracture assessment and for fatigue in materials where tensile cracks are the initiation mechanism. For a cast iron component (low ductility), the maximum principal stress governs failure, not von Mises. Reporting von Mises for a brittle material can give a safety factor that is 20 to 40 percent non-conservative for biaxial stress states where the principal stresses are not equal.
Maximum shear stress (Tresca): used for ductile yielding assessment in some codes (ASME Division 1 uses a modified Tresca criterion). The Tresca criterion is more conservative than von Mises by a factor of up to 15 percent for equibiaxial stress states.
Normal stress perpendicular to weld: for weld fatigue assessment (IIW recommendations, BS 7608), the relevant stress is typically the hot spot stress or the structural stress normal to the expected crack plane, not the von Mises stress at the weld toe.
Scale Factor Errors in Deformed Shape Interpretation
Deformed shape plots in FEA are typically displayed with an exaggerated scale factor (common values: 10x, 100x, 1000x) to make the deformation visible to the human eye when the actual deformation is small compared to the model dimensions. An exaggerated deformed shape is a useful visualization tool, but it cannot be used to assess the magnitude of deformation, the presence of interpenetration, or whether the deformation mode is physically reasonable
The specific error: using a highly exaggerated scale factor to assess contact behavior in an assembly. Two surfaces that appear to separate by a large gap in a 1000x scale factor plot may in fact overlap by 0.001mm in reality, which is physically impossible (interpenetration) and indicates either a mesh contact issue or an overly compliant model. Always switch to 1:1 true scale when assessing whether contact surfaces are behaving physically, whether parts are interpenetrating, or whether the actual displacement magnitude is acceptable.
The Pre-Analysis Checklist: Preventing These Errors Before They Propagate
The majority of the 16 errors in this article are preventable by a systematic pre-analysis and post-analysis review process. The following checklist covers the most critical checks at each stage of the FEA workflow.
What is the difference between FEA verification and validation? Verification confirms that the numerical solver correctly implements the mathematical model (solving the equations correctly). Validation confirms that the mathematical model represents the physical system accurately (solving the correct equations). In practice: the software vendor is responsible for code verification; the analyst is responsible for solution verification (mesh convergence) and model validation (comparison to analytical solutions or experimental data) on every analysis.
FEA Error Prevention Checklist
PRE-ANALYSIS (before building the model):
  [ ] Unit system written out explicitly (force, length, stress, density, modulus)
  [ ] All material properties verified against published source in correct units
  [ ] Temperature at which material properties apply matches operating condition
  [ ] Load magnitude, direction, and units verified against specification
  [ ] Support conditions mapped to physical mechanism (pin, roller, fixed, spring)
  [ ] Expected deformation mode and peak stress location documented before running

MODEL SETUP CHECKS:
  [ ] Unit system consistency: modulus, force, geometry in same system
  [ ] Constraint DOF check: exactly 6 DOF constrained (no more, no less for 3D static)
  [ ] Contact type matches physical interface (bonded vs frictional vs frictionless)
  [ ] Load direction vectors plotted and verified against expected direction
  [ ] Mesh convergence study completed for peak stress regions
  [ ] Element type appropriate for dominant structural behavior

POST-SOLVE CHECKS (before reporting any result):
  [ ] Reaction forces sum to applied loads (within 0.1%)
  [ ] Symmetry check: symmetric model shows symmetric results
  [ ] Deformation mode matches expected physical behavior
  [ ] Displacement magnitude in physically plausible range (hand calc comparison)
  [ ] Peak stress location makes intuitive engineering sense
  [ ] Peak stress compared to yield strength: if > Sy, linear results are invalid
  [ ] Stress quantity matches failure mode (von Mises vs principal vs shear)
  [ ] Averaged vs unaveraged stress comparison at peak location
  [ ] Deformed shape reviewed at 1:1 scale for contact interpenetration
  [ ] Analytical or hand calculation cross-check for at least one key result
Frequently Asked Questions
Q: What are the most common FEA mistakes that lead to wrong results?
The most consequential FEA errors fall into six categories: unit system inconsistency (mixing mm with GPa, or N with kN, which creates factors-of-thousands errors in all results), boundary condition errors (over-constraining with fixed supports instead of pins adds artificial stiffness; under-constraining causes rigid body motion), material property errors (wrong modulus, using linear material beyond yield), connection errors (bonded contact where separation or sliding should occur), load direction errors (global vs local coordinate confusion), and post-processing errors (averaged stress suppressing real peak, wrong stress quantity for the failure mode). All of these can produce results that look plausible while being systematically wrong.
Q: How do I detect a unit system error in my FEA model?
Perform a displacement sanity check: before reviewing any stress results, estimate the expected peak deflection using a hand calculation or analytical formula and compare it to the FEA result. A factor-of-1000 discrepancy indicates a unit error in the material modulus or applied force. Also check the reaction forces: they must sum to the applied loads. If you applied 1000 N and the reactions sum to 1.0 N, your forces were entered as kN when the model expects N. Prevent unit errors by writing out your unit system explicitly before building the model and verifying every material property input against its published source with explicit unit confirmation.
Q: What is the difference between averaged and unaveraged stress in FEA?
FEA computes stress at integration points inside each element, then extrapolates to the nodes at element corners. Where multiple elements share a node, each element produces a different stress value at that node because the stress field is discontinuous across element boundaries in finite element analysis. Averaged stress combines these multiple values into a single value at each node, producing a smooth contour. Unaveraged stress shows the individual element values without combining them. The difference between averaged and unaveraged at a location is a mesh quality indicator: a large difference signals that the mesh is too coarse to accurately resolve the stress gradient there. For peak stress reporting at stress concentrations, unaveraged stress is more conservative and more meaningful.
Q: Why does my FEA show stress above the material yield strength?
If a linear elastic material model is used, the FEA solver has no knowledge of the yield strength and will report stresses above yield without any warning. Linear elastic FEA can report any stress value regardless of whether it is physically achievable. Any linear elastic FEA result that exceeds the material yield strength is physically impossible as reported: the real material would have yielded and redistributed the stress. This does not mean the structure is safe – it means the model does not capture the real behavior. Options: run an elastoplastic nonlinear analysis to capture the post-yield behavior, or apply a plasticity correction method (Neuber’s rule) to estimate the true strain from the linear elastic stress result.
Q: How do I know if my FEA boundary conditions are correct?
Run a modal analysis before the static analysis. An unconstrained model will show 6 rigid body modes at near-zero frequency. Each zero-frequency mode represents one missing constraint, and the mode shape shows which translational or rotational direction is unconstrained. For over-constraining: run the analysis twice with different constraint types at the same location (fully fixed vs pin equivalent) and compare results. If the results differ by more than 10-20%, the rotational constraint assumption is significant and must be investigated. Also review the deformed shape: if the structure does not deform in the direction you expect given the applied loads, the boundary conditions are likely wrong.
Q: What is the most dangerous FEA error an engineer can make?
Using a linear elastic material model in a situation where the material is actually yielding under the applied loads. This produces a stress result above yield strength that the analyst may not recognize as physically impossible. The engineer then calculates a safety factor by dividing the reported stress by the yield strength, which gives a safety factor less than 1.0 (indicating imminent failure) but may interpret it as requiring a ‘redesign rather than immediate concern.
The real danger is when the analyst accepts the linear result, perhaps rounding down the peak to an averaged value, and arrives at a result just above yield that looks marginally safe. The actual behavior may involve significant plastic strain, fatigue initiation, and potential progressive failure that the linear model has no mechanism to predict.
Conclusion:
The 16 errors in this article share a common characteristic: every single one of them is predictable, recognizable in pattern, and preventable with the right pre-analysis and post-analysis discipline. They are not random artifacts of software complexity or numerical noise. They are the result of specific modeling decisions that do not correctly represent the physics of the problem, applied in ways that the FEA software cannot detect and cannot warn against.
The engineer’s defense against these errors is not just technical knowledge, though that is necessary. It is the intellectual discipline of questioning every result against an independent reference before accepting it. The equilibrium check is fast and catches load and unit errors. The hand calculation comparison catches magnitude errors. The deformation mode review catches direction and constraint errors. The averaged-vs-unaveraged comparison catches post-processing errors. None of these checks requires additional simulation runs. They require five to fifteen minutes of thoughtful review that transforms a result from an unverified number into a credible engineering evidence.
The engineers who consistently produce reliable FEA results are not those who never make any of these mistakes. They are the ones who have built systematic review habits that catch these mistakes before they propagate into engineering decisions. The checklist in this article is a starting point for building those habits. Apply it to your next analysis. The mistakes it prevents are not hypothetical.
Continue building your FEA competency with our guides on mesh quality and FEA accuracy, when to use linear vs nonlinear FEA, and the validation methods that confirm your results are physically correct.
An FEA result that has not been validated is a number. It may be accurate, or it may be wrong by a factor of two, or it may be capturing the wrong failure mode entirely. Without validation, the engineer has no basis for knowing which of these is true. The model ran. The solver converged. The stress map looks reasonable. None of these facts confirm that the result is correct.
Validation is what separates a credible analysis from an exercise in sophisticated guesswork. It is the process of confirming that the FEA model represents the physical system it is intended to represent, with a quantified level of confidence appropriate to the consequence of being wrong. For a concept design optimization, a modest confidence level may be adequate. For a pressure vessel that will operate near a nuclear reactor, or a structural implant that will be inside a human body for thirty years, the validation standard is considerably more demanding.
This article covers the complete FEA validation framework: the formal distinction between verification and validation, the hierarchy of validation methods from basic sanity checks through full experimental correlation, the error metrics that quantify how well FEA matches test data, the specific validation requirements in regulated industries, and the practical V&V documentation framework that supports both engineering defense and regulatory submission.
Verification vs Validation: The Distinction Every FEA Engineer Must Own
The terms verification and validation are routinely conflated in engineering practice, even by experienced analysts. They are not synonyms. They answer different questions, they require different methods, and responsibility for each falls on different parties. Confusing them produces validation plans that verify the wrong things and leave critical questions about model accuracy unanswered.
The definitions from ASME V&V 10-2006, the primary standard for verification and validation in computational solid mechanics, are the clearest and most widely cited:
Verification: the process of determining that a computational model accurately represents the underlying mathematical model and its solution. Verification asks: are we solving the equations correctly? It is concerned with numerical accuracy, mathematical correctness, and the absence of coding or implementation errors in the solver and the model.
Validation: the process of determining the degree to which a model is an accurate representation of the real world from the perspective of the intended uses of the model. Validation asks: are we solving the correct equations? It is concerned with whether the physics represented in the mathematical model accurately captures the physical behavior of the real system.
The critical implication of this distinction is that verification is largely the software developer’s responsibility, while validation is the analyst’s responsibility on every analysis. When you use Ansys, Abaqus, Nastran, or any other commercial FEA solver, you inherit the solver verification that the software vendor has performed. You do not re-verify the solver from first principles. What you must do, on every analysis, is validate your model of the specific physical system you are analyzing.
Solution Verification: The Analyst’s Verification Responsibility
While code-level verification is the software vendor’s domain, solution verification is the analyst’s responsibility. Solution verification confirms that the numerical solution computed by the solver is sufficiently accurate for the mathematical model that was formulated. The primary tool for solution verification is the mesh convergence study covered in the previous article in this series: demonstrating that the discretization (mesh) is fine enough that further refinement does not change the result meaningfully.
Solution verification also includes checking the patch test for the element types used. The patch test is the fundamental test of whether a finite element formulation can exactly reproduce a state of constant stress. Any element formulation that fails the patch test is mathematically deficient and should not be used. Commercial software elements are tested for patch test compliance during development, but analysts working with custom elements or unconventional formulations must verify patch test performance before relying on the results.
What is the difference between FEA verification and validation? Verification confirms that the numerical solver correctly implements the mathematical model (solving the equations correctly). Validation confirms that the mathematical model represents the physical system accurately (solving the correct equations). In practice: the software vendor is responsible for code verification; the analyst is responsible for solution verification (mesh convergence) and model validation (comparison to analytical solutions or experimental data) on every analysis.
The Validation Hierarchy: Ten Methods from Least to Most Rigorous
FEA validation is not a single activity but a spectrum of methods with different costs, confidence levels, and applicability. The appropriate method for any given analysis depends on the consequence of error, the available resources, and the regulatory context. Every analyst should understand all ten methods and know when to apply each.
Validation Method
When to Apply
Cost/Effort
Confidence Level
Limitations
Regulatory Acceptance
Analytical solution comparison
Always – for simplified models matching real physics
Low – analytical derivation only
High for matched cases
Limited to simple geometry and loading
Universal – highest credibility
NAFEMS benchmark comparison
Software selection and new problem types
Low – run benchmark models
High for matched benchmark
Only validates solver capability not model
Universal – well-documented benchmarks
Mesh convergence study
Every analysis with stress gradients
Medium – multiple mesh runs
High – demonstrates numerical convergence
Confirms numerical accuracy, not physics accuracy
Universal – required by most codes
Symmetry and equilibrium checks
Every analysis – basic sanity check
Very low – post-processing only
Medium – eliminates gross errors
Does not confirm stress magnitude accuracy
Universal – expected as minimum due diligence
Sensitivity analysis
Complex models with uncertain inputs
Medium – multiple parameter runs
Medium – shows influence of uncertainty
Does not confirm accuracy, only influence
Growing acceptance in FDA, EU MDR submissions
Classical mechanics cross-check
Simple structural cases
Low – hand calculation
High if problem is well-matched
Approximate for complex geometry
Universal – engineers must be able to sanity-check
Physical test correlation
High-consequence, regulated applications
High – test setup, instrumentation, specimen costs
Very high if properly correlated
Expensive; test conditions must closely match model
Required by FDA, FAA, ASME, NRC for safety-critical
Strain gauge correlation
Structural stress validation
High – instrumented test article
Very high for measured locations
Only validates accessible surface locations
Required by ASME Sec VIII Div 2 for pressure vessels
Digital image correlation (DIC)
Full-field surface strain validation
High – optical setup required
Extremely high – full field data
Surface only; no internal strain
Accepted by FDA, aerospace certification bodies
Historical data and expert review
All analyses lacking better alternatives
Very low – engineering time only
Low-Medium – subjective
No quantitative error bound
Minimum acceptable for non-safety-critical work
The methods in this table are ordered from least rigorous (historical data and expert review) to most rigorous (physical test correlation with DIC). More rigorous is not always better: the appropriate validation level is the minimum that provides adequate confidence for the engineering decision being supported, given the consequences of error. Applying full physical test correlation to a bracket supporting a light fixture is over-engineering the validation. Applying only historical data review to a pressure vessel component near a nuclear reactor is under-engineering it.
Level 1 Validation: Sanity Checks That Every Analysis Must Pass
The first level of FEA validation requires no test data, no benchmark comparisons, and no additional computational work. It uses the analysis results themselves, combined with basic engineering knowledge, to confirm that the model has not produced results that are physically impossible or obviously incorrect. These checks catch gross errors that would otherwise propagate forward into a credible-looking but fundamentally wrong analysis.
Equilibrium Check: Does the Model Sum Forces and Moments Correctly?
Every FEA model must satisfy global equilibrium: the sum of all reaction forces at the boundary conditions must equal the applied loads, and the sum of reaction moments must equal the applied moments. Most FEA solvers compute and report these equilibrium checks automatically in the output file. A reaction force sum that does not match the applied load within numerical precision (typically 0.1% or less) indicates a fundamental problem with the model: either loads or constraints have been incorrectly defined, or the model has numerical errors severe enough to violate equilibrium.
Symmetry Check: Does the Model Respect the Expected Symmetry?
If the geometry, loading, and boundary conditions are symmetric about a plane, the solution must also be symmetric about that plane. Any asymmetry in the results of a symmetric analysis indicates a modeling error: an incorrectly applied asymmetric load, an asymmetric material property assignment, or an incorrectly positioned boundary condition. This check is particularly effective at catching subtle errors in load direction or constraint application that produce results that look reasonable but are systematically wrong across the symmetry plane.
Deformation Mode Check: Does the Structure Deform as Physics Predicts?
Before examining any stress result, examine the deformed shape of the structure and ask: is this the deformation mode I expected? A cantilever beam under a tip load should show maximum deflection at the tip and zero deflection at the fixed end. A pressure vessel under internal pressure should show outward bulging. A column under compressive load should show axial shortening, not lateral displacement. Any deformation mode that contradicts the expected physical response indicates a modeling error that must be corrected before any stress result is meaningful
Load Path Check: Does the Model Transfer Load as Expected?
Plot the stress distribution and trace the load path from the applied forces to the reactions. The stress should be highest in the members that carry the most load and decrease as the load is distributed toward the supports. Any region showing unexpectedly high or low stress should be examined for modeling errors: incorrect material properties, missing connections, or erroneously applied constraints.
Minimum Validation Standard Every FEA analysis, regardless of its intended use or consequence level, should at minimum pass the four Level 1 sanity checks: equilibrium check (reactions equal applied loads), symmetry check (results respect model symmetry), deformation mode check (structure deforms physically), and load path check (stress distribution follows expected load path). Any analysis that fails one of these checks has a modeling error that must be corrected before proceeding to any further validation or result interpretation.
Comparison to analytical (closed-form) solutions is the most credible validation method available when the analytical solution exists and the model geometry and loading match the analytical assumptions well enough. An FEA result that agrees with a known exact solution within the expected discretization error is a validated result for that class of problem. The confidence in the analytical comparison transfers to the full model when the simplified problem and the full model share the critical physics that govern the structural response.
Building the Validation Model: Matching FEA to Analytical Assumptions
The most common mistake FEA in analytical comparison is applying an analytical solution to a problem whose assumptions it does not satisfy. The Euler-Bernoulli beam bending formula (sigma = M*y/I) assumes a long, thin beam with a uniform cross-section under pure bending, with no shear deformation, no geometric nonlinearity, and loads applied far from the measurement point. Applying this formula to validate FEA of a short, deep beam with a complex cross-section and concentrated loads will produce disagreement that tells you nothing meaningful about the accuracy of the FEA, because the analytical solution does not apply to the problem.
The correct procedure is to create a validation sub-model: a simplified version of the full FEA model that does match the analytical assumptions (same or simplified geometry, same loading type, same material model, same boundary conditions). Run the FEA on this validation sub-model. Compare to the analytical solution. If they agree within expected discretization error (typically less than 5% for a well-converged mesh), confidence in the FEA implementation is established. Then return to the full model, recognizing that the physics that were validated in the sub-model also operate in the full model.
Useful Analytical Solutions for Structural FEA Validation
Beam bending (Euler-Bernoulli or Timoshenko): deflection, slope, and stress along a beam under specified loading and boundary conditions. Valid for aspect ratios L/h > 10 for Euler-Bernoulli, L/h > 3 for Timoshenko with shear correction.
Hertz contact: contact pressure distribution, contact radius, and subsurface stresses for two elastic spheres or cylinders in contact. Validates contact nonlinearity implementation.
Lame equations for thick-walled cylinders: radial and hoop stress distribution through a pressurized thick-walled cylinder. Validates axisymmetric element and pressure loading accuracy.
Plate bending (Kirchhoff or Mindlin-Reissner): deflection and stress in a plate under uniform pressure for various boundary conditions. Validates shell element formulation.
Hertzian beam on elastic foundation: beam deflection and bending moment along a beam on a Winkler elastic foundation. Validates spring support boundary conditions.
Buckling load (Euler column): critical buckling load for a slender column under axial compression. Validates linear buckling eigenvalue analysis.
Level 3 Validation: NAFEMS Benchmark Problems
NAFEMS (the National Agency for Finite Element Methods and Standards, now operating as an international association) has published an extensive library of benchmark problems with reference solutions for a wide range of structural, thermal, fluid, and coupled physics analysis types. These benchmarks serve a different purpose from analytical comparison: they validate the solver’s implementation for problem types that have no exact analytical solution but have highly accurate reference numerical solutions computed by multiple independent methods.
The most widely used structural benchmark series is the NAFEMS Linear Static Benchmarks, which includes tests for 2D plane stress and plane strain elements, 3D solid elements, shell elements, beam elements, and various boundary condition types. Each benchmark provides: the problem geometry and loading, the reference solution for key result quantities (displacement, stress, natural frequency), and the expected accuracy range for a correctly implemented solver with a specified mesh density. A FEA model that matches NAFEMS benchmark results within the stated accuracy confirms that the solver implementation is correct for that element type and analysis type.
How to Use NAFEMS Benchmarks in Practice
The intended use of NAFEMS benchmarks is before starting a new type of analysis with an unfamiliar element type, solver setting, or problem configuration. If you are running your first large-displacement nonlinear analysis, run the NAFEMS nonlinear benchmark for that analysis type before the production analysis. If you are using a new contact formulation for the first time, run the NAFEMS contact benchmark. The benchmark confirms that your solver setup for this problem type is correct before you commit engineering resources to analyzing the actual structure.
NAFEMS benchmarks are available to NAFEMS members and through academic institutions. Several benchmark problems are also available in published form through NAFEMS conference proceedings and educational resources. Most major commercial FEA software vendors provide worked examples of their software running the NAFEMS benchmarks as part of their validation documentation, which can be used as secondary references if direct NAFEMS membership is not available.
Level 4 Validation: Experimental Correlation
Experimental correlation is the most expensive and most credible FEA validation method. It involves comparing FEA predictions against measurements taken on a physical test article under controlled loading, demonstrating that the simulation matches the measured physical behavior to within a quantified uncertainty band. For safety-critical applications, many regulatory bodies explicitly require experimental correlation as part of the design substantiation package, and the specific correlation methods, measurement techniques, and acceptance criteria are defined in the applicable code or standard.
The Experimental Validation Hierarchy: From Coupon to System
Experimental validation in aerospace, medical device, and nuclear industries follows a building-block approach: validation evidence is collected at progressively higher levels of structural complexity, from simple material test specimens through components, sub-assemblies, and ultimately the complete system. Each level builds on the confidence established at the level below.
Coupon level: simple specimens of the exact material, in the same manufacturing condition as the production component, tested under simple loading (tension, compression, bending) to establish material model parameters and validate material behavior. Material properties used in FEA must be traceable to coupon test data for the specific material and manufacturing process used in the production component.
Component level: single structural components (a bracket, a fastener, a weld joint) tested under representative loading to validate the FEA prediction of that component’s response. Component tests are where most FEA validation in product development occurs: strain gauges or DIC measurements on the component under measured loads, compared to FEA predictions at the same locations.
Sub-assembly level: groups of interconnected components under combined loading, validating the FEA model of assembly interactions including contact behavior, load transfer through fasteners, and joint stiffness. Sub-assembly validation is particularly important for bolted connections and press-fit assemblies where the individual component FEA is well-validated but the assembly behavior depends on interface conditions that are less certain.
System level: the complete product or structure under full operational loading, providing the highest-confidence validation but at the highest cost. System-level testing is typically limited to critical safety programs and regulatory demonstrations, not routine product development.
Strain Gauge Correlation: The Most Common Experimental Validation Method
Resistance strain gauges are the most widely used experimental measurement tool for FEA validation of structural components. They measure the surface strain at specific locations, which can be directly compared to the FEA-predicted strain at those locations. The correlation workflow involves applying gauges at locations where the FEA predicts significant strain (peak stress locations, load introduction points, strain concentration features), loading the test article to a measured load level, recording the gauge outputs, and comparing to the FEA predictions at the corresponding nodes and load level.
The correlation is expressed as a percent error at each gauge location: (FEA strain – measured strain) / measured strain x 100%. Acceptable correlation thresholds depend on the application: 5% or less is expected at well-characterized, accessible locations in structural steel components. 10 to 15% may be acceptable at locations with significant manufacturing variability (welds, castings) or where the gauge placement was not precisely at the FEA node location. Discrepancies greater than 15% at critical locations require investigation to determine whether the error source is in the FEA model, the test setup, or the measurement system.
Digital Image Correlation: Full-Field Validation
Digital Image Correlation (DIC) is an optical measurement technique that computes the full two-dimensional or three-dimensional surface strain field over a region of interest by tracking the deformation of a speckle pattern applied to the test article surface. Unlike strain gauges, which provide point measurements at pre-selected locations, DIC provides continuous full-field strain maps that can be directly compared to FEA contour plots over the entire measured region.
DIC validation is particularly powerful for identifying unexpected strain concentration locations that were not anticipated during the strain gauge placement plan: the DIC map reveals where the actual peak strains occur, even if those locations were not gauged. This is the most direct evidence that the FEA model correctly predicts not just the magnitude but also the spatial distribution of the strain field, which is the true measure of model quality for structural analysis.
Quantifying Correlation: Error Metrics for FEA Validation
Saying that FEA and test results agree well is not a quantitative validation statement. Professional FEA validation requires quantitative error metrics that express the degree of agreement between simulation and measurement in reproducible, comparable terms. The following metrics are used in published validation studies, regulatory submissions, and engineering design reviews.
Metric
Formula
Acceptable Threshold
What It Measures
When to Use
Percent error (single point)
|(FEA – Test)| / Test x 100%
<5% critical features; <10% secondary
Point-to-point deviation at specific location
Comparing FEA vs test at individual measurement points
Root Mean Square Error (RMSE)
sqrt(mean((FEA_i – Test_i)^2))
Application-specific; typically <10% of range
Overall scatter in FEA vs test across all measurement points
Full-field correlation quality across strain gauge array or DIC field
Correlation Coefficient (R^2)
1 – sum((FEA-Test)^2)/sum((Test-mean)^2)
R^2 > 0.95 for high confidence
How well FEA tracks test trends (not absolute accuracy)
No single error metric tells the complete validation story. A model with excellent percent error at one location may have poor correlation at another. A model with high R-squared correlation coefficient may have a systematic bias (consistently over- or under-predicting by a constant factor). A model with good overall RMSE may have poor correlation at the specific location that governs the safety decision.
The engineering approach is to report multiple metrics and investigate discrepancies rather than to report the best-looking metric and declare validation success. A validation that reports both the best-correlated and worst-correlated locations, with specific explanation of why the worst locations show more error, demonstrates far more analytical rigor and engineering credibility than a validation that only shows the cases where FEA and test agree well.
Sensitivity Analysis: Validation Through Input Variation
Sensitivity analysis is a validation-adjacent method that, while not a direct comparison to experimental data, provides critical information about the robustness of the FEA result to uncertainties in the model inputs. It asks: how much does the result change if the input parameters vary within their realistic uncertainty ranges? A result that changes dramatically with small input variations is inherently less credible than a result that is stable across the uncertainty range of its inputs.
What to Vary and What to Measure
The inputs to vary in a sensitivity analysis are those that carry meaningful uncertainty in the specific analysis: material modulus (typically well-characterized in metals but highly variable in polymers and composites), material yield strength (significant lot-to-lot variability in some materials), applied load magnitude and direction, boundary condition stiffness (especially for spring supports representing adjacent structure), friction coefficient at contact interfaces, and geometric dimensions within manufacturing tolerances.
For each varied input, compute the change in the critical result (peak stress, maximum deflection, natural frequency) as a percentage of the baseline value. Inputs that produce a 10% or greater change in the critical result are high-sensitivity inputs that deserve careful attention: their uncertainty must be well-characterized, and the conservative direction of their variation must be identified for the safety case. Inputs that produce less than 1% change in the critical result are low-sensitivity and can be treated as nominal in the final analysis.
Sensitivity Analysis in Regulatory Submissions
Regulatory bodies in medical device (FDA, EU MDR), aerospace (FAA, EASA), and nuclear (NRC) applications have increasingly recognized sensitivity analysis as a component of a complete V&V package. The FDA’s guidance on the use of computational modeling in medical device submissions (2016 and 2023 updates) explicitly discusses the role of sensitivity analysis in demonstrating that the FEA result is robust and that the conclusions drawn from the model hold across the realistic range of input uncertainty.
The practical benefit for regulated product development is that sensitivity analysis performed and documented during design validation creates an asset that directly supports regulatory submission, rather than requiring additional analysis during the submission review process.
Regulatory V&V Requirements by Industry
Regulated industries have specific, binding requirements for FEA validation that go beyond engineering best practice. Performing FEA without understanding the applicable regulatory V&V requirements is a significant compliance risk: a well-executed analysis that is documented in the wrong format or that does not include the required validation methods may be rejected by regulators, requiring expensive retrospective validation work or design modifications.
Medical Devices: FDA and EU MDR Requirements
The FDA’s guidance document ‘Reporting of Computational Modeling Studies in Medical Device Submissions’ (2016) establishes expectations for computational modeling V&V in device submissions. The guidance requires: documentation of model assumptions and their justification, verification evidence (mesh convergence, benchmark comparisons), validation evidence appropriate to the model’s intended use and the consequence of error, uncertainty analysis, and clear communication of model limitations.
The FDA uses a risk-based approach to determine the required validation rigor: the higher the risk of the device and the more central the computational model is to the safety and effectiveness evidence, the more extensive the validation evidence required. A low-risk dental implant using FEA as supporting evidence for a well-established design may require only analytical comparison and basic experimental correlation. A high-risk cardiac implant where FEA is the primary structural evidence may require extensive coupon-through-system validation with quantified uncertainty bounds.
Aerospace: FAA and MIL-STD Requirements
Aerospace structural analysis validation is governed by the AC 20-107B (Advisory Circular for Composite Aircraft Structure) for composite structures, and by structural substantiation requirements in the applicable aircraft certification basis (FAR Part 23, 25, 27, 29) for metallic structures. The primary validation method for aerospace FEA is the building-block test program, which provides experimental validation at each level of the structural hierarchy from coupon through full-scale component.
The DOD-HDBK-6870 (Probabilistic Failure Analysis Handbook) and the Department of Defense V&V framework provide additional guidance for defense system structural analysis. These frameworks require that computational models used for structural adequacy demonstration be validated against representative test data before being used for design decisions or certification evidence.
Pressure Vessels and Piping: ASME V&V 10
ASME has published ASME V&V 10-2006 (Guide for Verification and Validation in Computational Solid Mechanics) and ASME V&V 10.1-2012 (Example for Verification and Validation in Computational Solid Mechanics) as the primary V&V standards for pressure equipment FEA. These standards establish the formal framework for verification activities (patch tests, mesh convergence, code verification benchmarks) and validation activities (comparison to analytical solutions, experimental correlation at various structural levels) for FEA used in ASME Boiler and Pressure Vessel Code design submissions.
Engineers using FEA under ASME Section VIII Division 2 Design by Analysis methods are expected to follow the V&V 10 framework. The Division 2 Annex 5B explicitly requires that the analyst document the validation basis for the FEA model, including the analytical or experimental evidence that the model correctly captures the relevant physics. Without this documentation, the FEA-based design analysis is not substantiated under Division 2 regardless of how technically correct the underlying simulation may be.
The V&V Documentation Framework: Creating a Defensible Validation Record
A technically excellent validation that is poorly documented is nearly as problematic as a poorly executed validation. The validation record is the artifact that survives the analysis project: it is what engineers review when the design is questioned years later, what regulatory reviewers examine when evaluating a submission, and what legal counsel relies on when defending the engineering team. A complete validation record makes the analysis credible, defensible, and reusable.
FEA Validation Documentation Package Structure
SECTION 1: ANALYSIS SCOPE AND OBJECTIVES
  - What physical system is being modeled?
  - What question does the analysis answer?
  - What is the intended use of the results (design, certification, research)?
  - What are the consequences of an erroneous result?

SECTION 2: MODEL DESCRIPTION AND ASSUMPTIONS
  - Geometry: simplifications from actual geometry, justification for each
  - Material models: source of all material data, test data traceability
  - Loading: source, magnitude, direction, justification for applied loads
  - Boundary conditions: justification for each constraint; what they represent
  - Element types and mesh strategy: rationale for element selection

SECTION 3: VERIFICATION EVIDENCE
  - Mesh convergence study results (QoI vs element count table and plot)
  - Equilibrium check: reaction forces vs applied loads
  - Symmetry check results (if applicable)
  - Relevant benchmark comparison (NAFEMS or analytical sub-model)

SECTION 4: VALIDATION EVIDENCE
  - Method(s) used: analytical, benchmark, experimental (specify which)
  - For analytical: analytical problem definition, FEA setup, comparison table
  - For experimental: test setup description, instrumentation plan, load-measurement record
  - Correlation results: error metric values at all comparison locations
  - Discussion of discrepancies: where error exceeds threshold and why

SECTION 5: SENSITIVITY ANALYSIS
  - Parameters varied and their uncertainty range
  - Results: sensitivity of critical outputs to each input
  - Conservative analysis direction justified by sensitivity results

SECTION 6: UNCERTAINTY QUANTIFICATION
  - Total uncertainty budget: model form, parameter, numerical uncertainties
  - Confidence bounds on the critical result
  - Safety factor justification (if applicable) relative to uncertainty level

SECTION 7: CONCLUSIONS AND LIMITATIONS
  - What has been demonstrated by this validation?
  - What are the limits of applicability of this model?
  - What would require re-validation (geometry change, load change, new material)?
Frequently Asked Questions
Q: What is the difference between FEA verification and validation?
Verification asks ‘are we solving the equations correctly?’ and confirms that the computational model accurately implements the mathematical model. Validation asks ‘are we solving the correct equations?’ and confirms that the mathematical model represents the physical system. In practice: the FEA software vendor is responsible for code verification (ensuring the solver correctly implements finite element formulations); the analyst is responsible for solution verification (mesh convergence study proving numerical accuracy) and model validation (comparison to analytical solutions or experimental data proving physical accuracy) on every analysis.
Q: What is a patch test in FEA and why does it matter?
The patch test is the fundamental test of a finite element formulation’s mathematical completeness. It verifies that a mesh of elements in a general distorted configuration can exactly reproduce a state of constant stress and corresponding linear displacement field when subjected to appropriate boundary conditions. An element that fails the patch test cannot exactly represent constant stress states, which means it introduces systematic errors in all problems where the true stress approaches constant. Commercial software elements pass the patch test by design, but analysts using custom elements or unusual formulations must verify patch test performance before trusting the results.
Q: When is experimental validation required for FEA?
Experimental validation is required whenever FEA results are used as primary evidence for safety-critical design decisions in regulated industries. The FDA requires experimental correlation for medical device FEA used in submissions for high-risk devices. The FAA requires building-block test programs for aerospace structural certification. ASME requires documented validation evidence for FEA used in Division 2 Design by Analysis of pressure vessels. For non-regulated applications, experimental validation is best practice when the consequences of an incorrect FEA result are significant (personnel safety, major financial exposure) and when other validation methods do not provide adequate confidence in the model’s physical accuracy.
Q: What error tolerance is acceptable between FEA and experimental results?
Acceptable error depends on the application and the location of comparison. For structural stress validation at well-characterized, accessible locations in metallic components: less than 5% error is expected for high-confidence validation. Less than 10% is generally acceptable for engineering design validation. Less than 15% may be acceptable at locations with high manufacturing variability or uncertain gauge placement. Errors above 15% at critical locations require investigation to determine whether the error source is in the FEA model, the test setup, the measurement system, or the material property data. For modal analysis, natural frequency errors below 5% and MAC values above 0.9 for matched modes are the standard acceptance criteria.
Q: What is the NAFEMS benchmark and how do I use it for FEA validation?
NAFEMS (the National Agency for Finite Element Methods and Standards) has published an extensive library of benchmark problems with reference solutions for a wide range of structural, thermal, fluid, and coupled physics analysis types. Engineers use NAFEMS benchmarks to verify that their solver setup produces correct results for a specific element type and analysis type before running the production analysis. The workflow is: identify the NAFEMS benchmark that most closely matches your analysis type, build the benchmark model in your FEA software, run the analysis, compare your result to the NAFEMS reference solution, and proceed with the production analysis only if the benchmark comparison is within the expected accuracy range.
Q: What must a V&V documentation package include for a regulatory submission?
A complete V&V documentation package for regulatory submission should include: (1) Analysis scope and objectives, including intended use and consequence of error; (2) Model description and assumptions with justification for all simplifications; (3) Verification evidence including mesh convergence study results, equilibrium checks, and benchmark comparisons; (4) Validation evidence appropriate to the application risk level, which may range from analytical comparison for low-risk to full experimental correlation for high-risk; (5) Sensitivity analysis showing how the critical result responds to input uncertainty; (6) Uncertainty quantification establishing confidence bounds on the critical result; and (7) Conclusions including the limits of applicability of the model. The specific required content and format varies by regulatory body (FDA, FAA, ASME, NRC) and submission type.
Conclusion:
The engineer who runs an FEA, checks that it converged, and delivers the peak stress number without any validation has performed a sophisticated calculation and made an unquantified assumption that it is correct. That assumption may be valid. But the engineer cannot know that it is, and more importantly, no one reviewing the work can know it either.
Validation is what converts a calculation into evidence. It is the technical discipline of establishing, through structured comparison to known-correct solutions or physical measurements, that the FEA model represents the physical system it claims to represent, with a quantified degree of confidence appropriate to the engineering decision it supports. This is a higher standard than most engineering teams routinely meet, and meeting it requires effort, documentation, and in some cases physical testing. But it is the standard that the engineering profession owes to the people who use the products, infrastructure, and equipment that FEA analysis is used to design.
Start with the minimum: run every analysis through the four Level 1 sanity checks. Add analytical comparison for the class of problem the analysis represents. Document both. Add a mesh convergence study demonstrating numerical accuracy. Document it. For safety-critical applications, add the experimental correlation that the application demands. Document everything in a format that a reviewer can independently assess. That is the professional standard. This article has given you the framework and the specific methods to meet it.
Continue building your FEA expertise with our guides on when to use linear vs nonlinear FEA, mesh quality and its impact on accuracy, and the CAD modeling practices that create simulation-ready geometry.
An engineer running FEA on a bracket that will carry a cyclic load has a stress concentration at a fillet radius. The linear analysis runs in three minutes and the peak stress reads 180 MPa. The material yield strength is 250 MPa. The result looks reasonable. The bracket goes into service and fails at the fillet in fatigue after six months.
A post-mortem examination finds a stress concentration factor of 3.2 at the fillet. The true peak stress was approximately 576 MPa, well above yield, producing plastic strain accumulation and fatigue damage with every cycle. The FEA result of 180 MPa was not a modeling error in the traditional sense. The boundary conditions were correct, the material was correctly specified, the load was accurately applied. The error was in the mesh: coarse linear tetrahedral elements at the fillet, unable to capture the steep stress gradient, averaging out the peak and reporting a smooth, conservative-looking 180 MPa where the true peak was more than three times higher.
This scenario, or close variants of it, represents one of the most common categories of consequential FEA error in practice. It is preventable with mesh quality knowledge, and that knowledge is what this article provides. It covers what mesh quality metrics mean at a mathematical level, what numerical phenomena cause mesh quality to degrade results, how to select element types correctly, how to perform mesh convergence studies that verify your results are mesh-independent, and how to handle the specific problem of stress singularities that confuse the convergence picture for sharp geometric features.
Why Mesh Quality Matters: The Mathematical Foundation
Finite element analysis works by dividing a continuous structure into discrete elements, approximating the displacement field within each element using shape functions (also called interpolation functions or basis functions), and assembling the element equations into a global system of equations that is solved for the nodal displacements. Stresses and strains are then computed from these displacement solutions using the element’s strain-displacement and stress-strain relationships.
The accuracy of this approximation depends fundamentally on how well the element’s shape functions can represent the true displacement field within that element. Shape functions are polynomial functions defined in a natural (idealized) coordinate system for a perfect element shape. When the element’s physical shape deviates from the ideal, the mapping between the natural coordinate system and the physical coordinate system introduces additional terms in the strain-displacement relationship that the ideal shape function formulation did not account for. These additional terms are the source of mesh-quality-induced error.
The Jacobian Matrix: Where Shape Quality Becomes Mathematical
The Jacobian matrix is the key mathematical link between an element’s physical shape and the accuracy of its numerical integration. It is the matrix of partial derivatives of the physical coordinates (x, y, z) with respect to the natural coordinates (xi, eta, zeta) of the idealized element. For a perfectly shaped element (square quad, equilateral triangle, regular tetrahedron, cube), the Jacobian matrix is constant throughout the element and its determinant, the Jacobian determinant, is constant and positive.
When an element is distorted (stretched, skewed, or warped), the Jacobian matrix varies across the element. If the distortion is severe enough, the Jacobian determinant can approach zero or even become negative at integration points within the element. A negative Jacobian indicates an inverted element: the element’s physical shape has been distorted so severely that the natural-to-physical mapping is no longer one-to-one. An inverted element will cause the FEA solver to either crash outright or produce completely incorrect results at that element’s location.
Between the ideal (Jacobian = 1.0 everywhere) and the inverted (Jacobian < 0.0) cases lies a spectrum of degraded accuracy. Jacobian values below 0.6 at any integration point indicate that the element shape distortion is significant enough that the shape function approximation is meaningfully compromised. Most professional FEA solvers (Ansys, Abaqus, Nastran, MSC Marc) flag elements below this threshold as potentially problematic and will warn the analyst. Some solvers allow the analyst to set the minimum acceptable Jacobian below which the analysis will be aborted.
Strain-Displacement Error: Why Aspect Ratio Matters
The aspect ratio of an element (the ratio of its longest edge to its shortest edge) directly affects the accuracy of the strain-displacement relationship within the element. In a well-shaped element with an aspect ratio near 1.0, the shape functions accurately interpolate both displacements and their spatial derivatives (strains) throughout the element volume. In a high-aspect-ratio element (an elongated or stretched element), the shape functions accurately capture displacement variation along the long axis but poorly capture variation along the short axis.
For structural FEA, this directional error in strain capture becomes critical in bending-dominated behavior. A beam element in bending has steep strain gradients across its thickness (the short dimension) and shallow gradients along its length (the long dimension). An elongated element aligned along the beam’s length will poorly capture the through-thickness strain gradient, underestimating the bending stiffness and the peak bending stress. This is why element aspect ratios above 5:1 in bending-dominated regions are considered problematic, while ratios up to 20:1 or even higher may be acceptable in membrane-dominated regions where the strain variation is aligned with the long element axis.
Mesh Quality Metrics: Thresholds, Meanings, and Measurement
Every major FEA solver provides mesh quality checking tools that compute and display quality metrics for every element in the model. Understanding what each metric measures, what the acceptable ranges are, and how violations of each metric affect the results is essential for interpreting these quality reports and deciding which elements need to be improved.
Metric
What It Measures
Ideal Value
Warning Threshold
Failure Threshold
Effect of Violation
Aspect Ratio
Ratio of longest to shortest element edge
1.0 (equilateral)
5:1 (hex/tet general)
10:1+ or 20:1 (bending-dominated)
Stiffness overestimation in bending; numerical ill-conditioning at high ratios
Jacobian (Normalized)
How well element shape maps from natural to physical coordinates
1.0 (perfect shape)
0.6 minimum (most solvers)
<0.0 (inverted element – always fix)
<0.6: shape function errors; <0.0: solver crash or completely wrong results
Skewness
Angular deviation of element from ideal shape
0.0 (no skew)
0.85 for FLUENT; 0.90 for structural
0.95+ (always fix)
Interpolation error in stress/strain; poor convergence in high-gradient regions
Severe interpolation errors; locking or excessive flexibility
Element Size Ratio (growth rate)
Transition rate between fine and coarse mesh regions
1.0-1.2 between adjacent elements
2.0 max in stress gradient regions
5.0+ (abrupt transition)
Stress discontinuity at mesh transitions; missed peak stress
Orthogonal Quality (Fluent CFD)
Element face orientation relative to flow direction
1.0 (best)
0.1 minimum
<0.01 (critical)
Diffusion errors in CFD; incorrect boundary layer resolution
How to Use This Table in Practice
The thresholds in this table are general guidelines, not absolute rules. The appropriate threshold depends on the analysis type, the solver being used, and the location of the element in the model. An element in a low-gradient region (far from stress concentrations, in a region dominated by uniform loading) can tolerate worse quality metrics than an element at a stress concentration or in a region with steep gradients.
The most important rule: zero inverted elements (negative Jacobian) in any final analysis mesh. This is the one mesh quality violation that is unambiguous: an inverted element always produces incorrect results and should always be corrected before running the analysis. All other quality metrics involve a judgment call based on the acceptable error level for the specific application, but negative Jacobian elements have no acceptable level.
Element Type Selection: The Decision That Precedes Mesh Quality
Before mesh quality metrics become relevant, the engineer must choose the element type for the analysis. This decision, made before the first element is created, determines the theoretical accuracy ceiling that even a perfect mesh can achieve. A mesh of perfectly shaped elements of the wrong type will produce results that are less accurate than a good mesh of the right type, regardless of how well the quality metrics score.
Element Type
DOF per Node
Captures Bending?
Accuracy vs Cost
Best Use Case
Avoid For
Linear Tet (C3D4/TET4)
3
No (constant stress)
Very poor accuracy for its cost
Never use alone for stress analysis
Any stress analysis – always use quadratic tet instead
Thick cross-sections, high shear-to-bending ratio applications
The Linear Tetrahedral Element: Why You Should Almost Never Use It
The linear tetrahedral element (C3D4 in Abaqus, TET4 in general) is the most commonly misused element in FEA practice. It is easy to generate automatically from CAD geometry using any commercial meshing tool, it creates meshes quickly, and it produces a solver file that runs without errors. For all of these reasons, it is the default element in many automatic meshing workflows, and for all of these reasons, it is a poor choice for structural stress analysis.
The linear tet element has only four nodes, each at a corner of the tetrahedron, and a constant stress field throughout the element volume. The displacement varies linearly from node to node, and because stress is the derivative of displacement, a linearly varying displacement produces a constant (zero-order) stress within each element. This means that a stress gradient across a region requires many elements to approximate, and the predicted peak stress is always an average over the element rather than a true point value. At a stress concentration, a linear tet mesh systematically underestimates the peak stress because the constant stress element cannot capture the steep gradient.
The quadratic tetrahedral element (C3D10 in Abaqus, TET10 in general) adds six mid-side nodes to the four corners, giving ten nodes total and a quadratic displacement field within the element. Because the displacement is quadratic, the stress (its derivative) is linear, meaning the stress can vary from corner to corner within a single element. This fundamentally different capability means that a quadratic tet mesh with the same element density captures stress gradients and stress concentrations dramatically better than a linear tet mesh. For complex organic geometry where hex meshing is impractical, the quadratic tet is the correct choice.
The Hourglassing Problem in Reduced-Integration Elements
Reduced-integration hexahedral elements (C3D8R in Abaqus, SOLID185 in Ansys) use one integration point at the element center rather than the full 2x2x2 = 8 integration point scheme of full-integration elements. This halves the computational cost of the element stiffness calculation, making them efficient for large models. However, reduced integration introduces a specific failure mode called hourglassing or zero-energy modes: deformation modes of the element that produce no strain energy at the single central integration point and therefore produce no restoring stiffness.
Hourglassing appears in the solution as a characteristic zig-zag displacement pattern visible in the deformed mesh, where alternating elements displace in opposite directions with very large magnitudes. The solution diverges from physical reality while the solver reports convergence (because the energy residual is still small, just distributed in a physically meaningless deformation pattern). Modern solvers include hourglass control algorithms that add artificial stiffness to resist the zero-energy modes, but these algorithms involve a user-defined scale factor that can either under-control (allowing hourglassing to corrupt results) or over-control (adding artificial stiffness that affects the real structural response).
The safest approach: use reduced-integration elements only when hourglass control is well-calibrated for the specific analysis type (dynamic explicit analyses where hourglassing is well understood and controlled, forming simulations where the software vendor has verified the hourglass control parameters), or switch to full-integration elements where hourglassing is not possible. For static stress analysis of structures where the mesh is not excessively distorted, full-integration elements are generally preferred despite their higher computational cost.
Mesh Convergence Studies: The Only Way to Know Your Results Are Reliable
The most important mesh quality verification tool available to every FEA analyst is the mesh convergence study: a systematic process of refining the mesh and comparing results across refinement levels to determine whether the results have converged to a mesh-independent value. A result that changes significantly as the mesh is refined is not reliable, because the level of refinement determines the answer rather than the physics. A result that stabilizes as the mesh is refined demonstrates that the mesh is fine enough to capture the relevant physics and that further refinement would not change the result meaningfully.
The Convergence Study Protocol
Identify the quantity of interest (QoI): Before meshing, identify the specific result that must be accurate: peak von Mises stress, maximum deflection, natural frequency, reaction force, temperature at a specific location. Mesh convergence is always with respect to a specific QoI, because different quantities converge at different rates with mesh refinement.
Create an initial coarse mesh: Generate the first mesh at a deliberately coarse element size. This is not the mesh you will use for the final analysis; it is the starting point for the convergence study.
Extract and record the QoI: Run the analysis on the coarse mesh and record the QoI value, the element count, and the total solve time.
Refine globally or locally: Reduce the element size by a factor of 2 (halving the mesh size in each dimension multiplies the element count by roughly 8 for 3D solid meshes). This is the h-refinement approach. Alternatively, increase the element polynomial order (p-refinement) while keeping the mesh coarse.
Repeat and plot convergence: Run the refined mesh, record the QoI, and plot QoI versus element count (or element size). Continue refining until the change in QoI between successive refinements is below a specified convergence criterion.
Apply Richardson extrapolation: Using two or more refinement levels, apply Richardson extrapolation to estimate the exact solution value and the discretization error. This provides a quantitative uncertainty estimate for the result rather than a qualitative judgment about whether the curve looks flat.
Mesh Convergence Convergence Criterion and Richardson Extrapolation CONVERGENCE CRITERION: Change in QoI from mesh N to mesh N+1 < 5% (engineering acceptable) Change in QoI from mesh N to mesh N+1 < 2% (high confidence) Change in QoI from mesh N to mesh N+1 < 1% (precision required)
RICHARDSON EXTRAPOLATION (2-level): Given: QoI_1 at mesh size h1, QoI_2 at mesh size h2 = h1/2 Estimated exact value: QoI_exact = QoI_2 + (QoI_2 - QoI_1) / (2^p - 1) where p = convergence order (p=2 for linear elements, p=3+ for quadratic)
Recommendation: Level 4 is adequate for engineering decisions. Level 5 adds 8x more elements for 0.9% additional accuracy.
h-Refinement vs p-Refinement vs hp-Refinement
Three mathematically distinct strategies exist for improving mesh accuracy: h-refinement reduces the element size (more, smaller elements of the same type), p-refinement increases the polynomial order of the element shape functions (same mesh, higher-order elements), and hp-refinement applies both simultaneously in a coordinated manner.
For smooth problems without singularities, p-refinement converges much faster than h-refinement: doubling the polynomial order of the elements reduces the error by a factor of 2^p, whereas halving the element size reduces the error by a factor of 2^p (where p is the order of the current elements). For a linear element mesh (p=1), halving the element size reduces the error by a factor of 4. For a quadratic element mesh (p=2), raising to cubic (p=3) may reduce the error by a factor of 8 for the same computational investment.
For problems with stress singularities (sharp corners, crack tips, contact edges), neither h-refinement nor p-refinement converges the local stress to a finite value, because the true solution has an unbounded stress gradient at the singularity. These cases require either singularity enrichment elements (special elements with the correct singular displacement field built into the shape functions, used in fracture mechanics), or deliberate exclusion of the singularity point from the convergence study, reporting the stress at a location removed from the singularity rather than at the singular point itself.
Stress Singularities: Where Mesh Convergence Studies Mislead
One of the most important and most frequently misunderstood aspects of FEA mesh quality is the stress singularity: a location in the model where the mathematical solution for the stress field approaches infinity, even though the real physical stress is finite. Stress singularities occur at sharp internal corners (re-entrant corners), at point loads or point constraints, and at crack tips in fracture mechanics problems. Every engineer using FEA must understand why singularities occur and how to handle them correctly.
Why Sharp Corners Produce Infinite Stress in FEA
Classical elasticity theory, which FEA implements numerically, predicts unbounded stress at sharp geometric re-entrant corners. This prediction is mathematically correct within the theory, but it does not represent a physical impossibility: in reality, every sharp corner has a finite radius (even if very small), every real material has a finite yield strength that prevents unbounded stress accumulation, and in fatigue design the relevant quantity is not the point stress at the corner but the stress in the process zone around it.
In an FEA model with a sharp internal corner, as the mesh is refined toward the corner, the peak stress continues to increase without bound. A convergence study at the corner node will show stresses that grow with every mesh refinement level and never converge to a stable value. An engineer who does not recognize this pattern may interpret the lack of convergence as a signal that the mesh needs further refinement, when in fact the correct response is to change the modeling strategy: add a fillet radius to the model geometry, or extract the stress at a location removed from the singularity using a Saint-Venant distance criterion.
The Saint-Venant Principle for Practical Stress Extraction
Saint-Venant’s principle states that the stress distribution at a cross-section far enough from a localized load or constraint is essentially independent of the exact distribution of that load. In FEA practice, this principle is applied to singularities: the stress at a distance from the singular point equal to the largest characteristic dimension of the stress perturbation is mesh-independent and physically meaningful, even though the stress at the singular point itself is not.
For a re-entrant corner in a plate under tension, the stress approximately one fillet-radius distance away from the corner is mesh-converged and corresponds to the local stress that governs fatigue initiation in the real structure. This is the quantity to extract and report, not the stress at the corner node itself. Most FEA guidelines for fatigue assessment of welded structures, pressure vessels, and aerospace structures define hot spot stress or structural stress methodologies that explicitly extract stress at defined distances from the geometric discontinuity for exactly this reason.
Adaptive Meshing: Automating the Convergence Process
Adaptive mesh refinement (AMR) is an FEA capability that automates the convergence study by computing an error estimate at each element, identifying elements where the error estimate exceeds a target threshold, and automatically refining those elements before solving again. The process iterates until all elements meet the error target. The result is a mesh that is fine where the physics demand it and coarse where coarse elements are adequate, without the engineer having to manually identify and refine high-error regions.
Error Estimators: How the Software Knows Where to Refine
Adaptive meshing requires an error estimator: a mathematical measure of how much error is present in each element’s solution. The most common type is the stress discontinuity error estimator, based on the observation that in an exact FEA solution, the stresses should be continuous across element boundaries. In a mesh of finite elements, the stresses are computed independently in each element and are generally discontinuous at the element boundaries. The magnitude of this stress discontinuity at each element boundary is proportional to the error in the adjacent elements.
The Zienkiewicz-Zhu (ZZ) error estimator is the most widely implemented in commercial FEA software. It computes a smoothed, continuous stress field by averaging the element stress values at each node, then computes the difference between the smoothed field and the element-level field at each integration point. The norm of this difference is the element error indicator. Elements with high error indicators are refined in the next adaptive cycle. The ZZ estimator is available in Ansys (as the Energy Norm Error tool), in Abaqus (as the error indicators for mesh-to-mesh solution mapping), and in Nastran (as the mesh sensitivity study tools).
When Adaptive Meshing is and Is Not Appropriate
Adaptive meshing is most effective for smooth problems without singularities: structural analysis of continuous components with smooth geometry under smoothly varying loads. In these cases, the error estimator correctly identifies regions of high error, the mesh refinement reduces that error efficiently, and the process converges to a well-distributed mesh with predictable accuracy.
Adaptive meshing is less effective for problems with singularities because the error estimator correctly identifies the singularity as a high-error region and will attempt to refine it indefinitely. Most adaptive meshing implementations include maximum refinement limits to prevent infinite refinement at singularities, but the result is typically a very fine mesh concentrated at the singularity that does not improve the physically meaningful stress result because the true solution at the singularity is unbounded. For these problems, the engineer must either remove the singularity by geometric modification (adding a fillet) or apply the Saint-Venant extraction strategy manually.
Platform-Specific Mesh Quality Guidance
Each major FEA platform has its own implementation of mesh quality checking, quality metric naming conventions, and default threshold settings. Knowing the specific tools in your platform and how to interpret their outputs prevents the confusion that arises when metric names or thresholds differ between platforms.
Ansys Mechanical
Ansys Mechanical provides mesh quality metrics under Mesh > Mesh Quality. The primary metrics available include: Element Quality (a composite metric from 0 to 1, target > 0.5 for most elements), Aspect Ratio (target < 5 for most analyses), Jacobian Ratio (target > 0.6 at all integration points, > 0 required), Warping Factor (target < 0.4 for shell elements), Maximum Corner Angle (target < 170 degrees), and Skewness (target < 0.9 for structural, < 0.85 for thermal/CFD).
The Ansys mesh quality report displays histograms of each metric and allows the engineer to visually identify elements below threshold. The Named Selections feature allows poor-quality elements to be selected, inspected, and manually remeshed using local mesh controls (sphere of influence, edge sizing, face sizing) without remeshing the entire model.
Abaqus/CAE
Abaqus uses the Verify Mesh tool (Mesh menu > Verify) to check element quality. Abaqus reports: warnings for elements where the Jacobian at any integration point is between 0 and the user-defined warning threshold (default 0.1), errors for elements with negative Jacobian, and analysis checks for elements where the aspect ratio exceeds the warning threshold. Abaqus additionally provides error indicators as output variables (ENDENERI, ESEDEN) that can be plotted as contour maps to visualize where mesh refinement would most improve the solution accuracy.
Siemens NX Nastran
Nastran provides the DMIG (Direct Matrix Input at Grid points) and PBARL/PBEAML beam cross-section quality metrics, but mesh quality checking for solid and shell elements is primarily performed in the pre-processor (Femap, NX Meshing) before the Nastran analysis is run. The pre-processor provides element quality checks including Jacobian, aspect ratio, warpage, taper, and interior angle checks with thresholds that can be customized for the specific Nastran solver version and analysis type. Nastran CBUSH and RBE element quality is checked separately through model validation routines that verify constraint consistency.
Frequently Asked Questions
Q: What is mesh quality in FEA and why does it matter?
Mesh quality in FEA describes how well the shape, size, and distribution of the finite elements approximate the geometry and physics of the problem being analyzed. Poor mesh quality degrades accuracy because finite element shape functions are derived for ideally shaped elements. When elements are distorted (high aspect ratio, skewed, or warped), the shape function approximation introduces errors in the computed strain and stress fields. The most critical quality metric is the Jacobian: an element with a negative Jacobian (inverted element) is always incorrect and must be fixed. Elements with Jacobian below 0.6 may produce inaccurate results in high-gradient regions.
Q: What is an acceptable aspect ratio for FEA mesh elements?
For general structural analysis, aspect ratios below 5:1 are acceptable for most element types. In bending-dominated regions, ratios above 5:1 can cause underestimation of bending stiffness and peak stress because the short-axis strain gradient is poorly captured. In membrane-dominated regions where the strain variation aligns with the long element axis, ratios up to 20:1 may be acceptable. For shell elements in the bending direction (through-thickness), at least 4 elements are typically required to capture the stress gradient accurately, which implies aspect ratios should be kept below 5:1 in the critical direction even if the overall element aspect ratio is higher.
Q: Should I use tetrahedral or hexahedral elements for structural FEA?
Quadratic tetrahedral elements (10-node tet) are generally the better choice for complex organic geometry because they can be generated automatically from CAD geometry and provide good accuracy with a reasonable element count. Linear tetrahedral elements (4-node tet) should almost never be used for structural stress analysis because their constant stress field systematically underestimates stress concentrations. Hexahedral (brick) elements provide the best accuracy per degree of freedom but require structured or semi-structured meshing that is time-consuming for complex geometry. The practical recommendation: use quadratic tet for complex geometry, use hex where geometry allows structured meshing and maximum accuracy is required.
Q: What is a mesh convergence study and how do I perform one?
A mesh convergence study is a systematic process of refining the mesh and tracking the change in a specific result quantity (peak stress, maximum deflection, natural frequency) across refinement levels. When the result changes by less than a specified percentage (typically 5% for engineering decisions, 2% for high-confidence analysis) between successive refinements, the mesh is considered converged. The process involves creating 3 to 5 mesh refinement levels with progressively smaller elements, running the analysis at each level, plotting the result versus element count, and checking whether the curve has plateaued. Richardson extrapolation can be applied to estimate the exact value and quantify the remaining discretization error.
Q: What is a stress singularity in FEA and how do I handle it?
A stress singularity is a location in the FEA model where the mathematical stress solution is unbounded (approaches infinity), even though the real physical stress is finite. Singularities occur at sharp re-entrant corners, at point loads, at point constraints, and at crack tips. In an FEA model with a singularity, the predicted stress at the singular point increases without bound as the mesh is refined, and a convergence study at that location will never converge.
The correct handling depends on the context: add a physical fillet radius to represent the real geometry, extract the stress at a distance from the singularity using Saint-Venant’s principle, or use specialized fracture mechanics elements at crack tips. Never report the stress value at a singular point as a meaningful result.
Q: What is hourglassing in FEA and how do I prevent it?
Hourglassing (also called zero-energy modes or kinematic modes) is a numerical instability that occurs in reduced-integration elements (elements using fewer integration points than the full integration scheme). The reduced integration point scheme fails to detect certain deformation modes (the hourglass modes) because these modes produce no strain at the single central integration point. The solution exhibits a characteristic checkerboard pattern of displacements with large magnitudes that is entirely non-physical. Modern solvers include hourglass control that adds artificial stiffness to resist hourglass modes. To prevent hourglassing: use full-integration elements in static stress analysis, use at least two or three elements through any thin-walled section, and review the deformed mesh carefully for checkerboard patterns after any analysis using reduced-integration elements.
Conclusion:
Every quality metric, threshold, and guideline in this article is a tool for engineering judgment, not a substitute for it. The mesh quality checker that reports all elements above 0.6 Jacobian and below 5:1 aspect ratio has done its job, but it cannot tell you whether those elements are in the right places, whether the mesh is fine enough near the features that govern the structural response, or whether the convergence study has been correctly interpreted for a problem with stress singularities.
The engineering judgment is: identifying the critical regions before meshing (where are the stress concentrations, the load introduction points, the contact interfaces?), choosing element types appropriate for the dominant structural behavior, performing a convergence study with respect to the quantity that actually matters for the engineering decision, and correctly distinguishing converging results from singularity behavior. These judgments are what the quality metrics support and inform, but they are not substituted by the metrics.
An FEA result supported by a mesh convergence study that demonstrates less than 5 percent change between the final two refinement levels, with no inverted elements, no Jacobian values below 0.6 in high-gradient regions, and element type selection appropriate for the dominant structural behavior, is a result that can be defended in an engineering review and relied upon for a design decision. That is the standard the discipline demands and the standard this article has provided the tools to meet.
Every engineer running FEA faces this decision. The model is built, the boundary conditions are defined, and the load case is ready. Now: linear static analysis, which runs in minutes and converges every time, or nonlinear analysis, which may take hours, requires careful setup, and can fail to converge in ways that are genuinely difficult to diagnose? The choice is consequential in both directions: choose linear when the problem is actually nonlinear and you risk results that are not just inaccurate but potentially dangerously non-conservative. Choose nonlinear when linear would have been adequate and you pay a computational and setup cost that serves no engineering purpose.
The answer is not simply to always use nonlinear FEA because it is more realistic. Nonlinear analysis is not more accurate than linear analysis when the physical behavior is genuinely linear. It is slower, more complex to set up, harder to troubleshoot when it fails, and requires more engineering judgment to interpret correctly. Linear analysis, when its assumptions hold, provides exactly correct results with a fraction of the computational effort. The engineering skill is knowing which assumptions hold and when they do not.
This article provides that knowledge in specific, actionable terms. It covers the three types of nonlinearity that drive the decision, the quantitative thresholds that define when each type becomes significant, the computational cost multipliers engineers need to know when making this decision under schedule pressure, the 12-scenario decision table that covers the situations most engineers encounter, how to use a linear pre-check as a diagnostic tool before committing to nonlinear analysis, and the convergence troubleshooting framework for when nonlinear analyses fail.
The Three Linear FEA Assumptions: Understanding What You Are Committing To
Linear FEA rests on three simultaneous assumptions. When all three hold, linear analysis is not just computationally convenient: it is the theoretically correct analytical approach. When any one of the three fails, the linear model produces results that may range from slightly over-conservative to catastrophically wrong depending on the degree and type of nonlinearity present. Understanding exactly what each assumption states, why it breaks down, and what the consequences of its failure are is the foundation of making the linear-versus-nonlinear decision correctly.
Assumption 1: Small Displacements and Small Strains (Geometric Linearity)
Linear FEA assumes that the deformations of the structure are small enough that: the structure’s original geometry adequately represents its deformed geometry for equilibrium calculations, the stiffness of the structure does not change as it deforms, and the strain-displacement relationships remain linear. These three sub-assumptions together are called geometric linearity or the small-displacement assumption.
When this assumption holds, the stiffness matrix [K] computed at the undeformed configuration is the same stiffness matrix that applies throughout the loading, and the equilibrium equation [K]{u} = {F} is solved once to give the complete displacement field. When it fails, the stiffness matrix changes as the structure deforms, and the equilibrium equation must be re-solved at each increment of load with an updated stiffness matrix.
The practical threshold for geometric nonlinearity is generally: if the maximum deflection exceeds 5 to 10 percent of the smallest characteristic structural dimension (the minimum cross-sectional dimension, the plate thickness, the beam height), or if the maximum strain exceeds 1 to 5 percent, geometric nonlinearity is likely to produce results that differ meaningfully from linear analysis. Below these thresholds, geometric nonlinearity effects are typically less than 5 percent of the linear result, which is within the accuracy range of FEA for most engineering purposes.
For stocky, compact structures loaded in their primary stiffness direction, this assumption is rarely violated at service load levels. For slender structures, flexible membranes, snap-fit features, and any structure where the loading direction changes relative to the deformed shape, this assumption should be examined explicitly before committing to a linear analysis.
Geometric Nonlinearity Quick Test Step 1: Run a linear static analysis. Step 2: Check the maximum displacement. Step 3: Divide by the smallest characteristic dimension (beam height, plate thickness, shell radius). Step 4: If the ratio exceeds 0.05 (5%), re-run with geometric nonlinearity enabled (large displacement option in your solver). Compare results. If they differ by more than 5%, the nonlinear result is more accurate and you should use it. If they are within 5%, linear is adequate for geometric effects.
Assumption 2: Linear Elastic Material Behavior (Material Linearity)
Linear FEA assumes that the relationship between stress and strain is linear throughout the structure for the entire loading history. This is Hooke’s Law: stress equals Young’s modulus times strain, and the material returns to its original shape when the load is removed. The elastic modulus E is constant, and there is no plastic deformation, no creep, no viscosity, and no damage accumulation.
This assumption breaks down when the stress anywhere in the structure reaches or exceeds the material’s yield strength. Beyond yield, the stress-strain relationship is no longer linear: the material work-hardens (in the case of most metals) or softens, and the stiffness changes. More critically, the strain at a point is no longer uniquely determined by the current stress: it depends on the loading history, which linear analysis has no mechanism to capture.
For steel components at service load levels, material linearity is often an excellent assumption: structural steel has a well-defined linear elastic region up to approximately 250 MPa (for mild steel) or 690 MPa (for high-strength steel). If the peak von Mises stress in a linear analysis remains below approximately 70 to 80 percent of the yield strength, material nonlinearity effects are negligible. Above this threshold, and certainly above yield, material nonlinearity must be addressed explicitly.
Elastomers, rubber, biological tissues, and polymer foams are material nonlinear by nature: their stress-strain behavior is nonlinear even at small strains because these materials are inherently non-Hookean. These materials require hyperelastic material models (Mooney-Rivlin, Ogden, Neo-Hookean) that capture the nonlinear stress-strain behavior from the beginning of loading, not just after a yield point is reached.
Assumption 3: Linear Boundary Conditions (Contact and Constraint Linearity)
Linear FEA assumes that the boundary conditions, the points and surfaces where loads are applied and where motion is constrained, remain constant and fixed throughout the analysis. All contacts between parts are either fully bonded (no separation, no sliding) or fully free (no interaction). Loads are applied at fixed points in fixed directions. Constraints do not change as the structure deforms.
This assumption fails whenever contact between surfaces changes during loading: two surfaces that start in contact may separate under certain load conditions, two surfaces that start separated may come into contact, and sliding contact introduces friction-dependent tangential forces at the interface. It also fails when applied forces change direction as the structure deforms (follower forces), or when boundary conditions are load-dependent.
Contact nonlinearity is computationally the most challenging of the three types because it introduces discontinuous changes in the stiffness matrix: when a node goes from not-in-contact to in-contact, the number of active constraints in the model changes suddenly, causing numerical instability in the iterative solution process. This is why bolted joint analyses, press-fit analyses, rubber seal compression, and bearing-race interfaces are all inherently nonlinear: the contact state is part of the solution, not a known input.
The Three Nonlinearity Types: Engineering Examples and Thresholds
Understanding the three assumption types in the abstract is necessary but not sufficient. The engineering value comes from being able to recognize, in a specific design and loading scenario, which type of nonlinearity is present and how significant it is likely to be.
Geometric Nonlinearity: When Structure Changes Its Own Stiffness
The most common scenario for geometric nonlinearity is a slender structure under lateral load. A fishing rod bent by the weight of a fish, a snap-fit clip at its maximum deflection, a thin-walled tube under internal pressure combined with bending, a membrane structure under applied pressure: in all of these cases, the deformed shape of the structure is significantly different from the original shape, and the equilibrium of forces must be assessed in the deformed configuration.
There are two specific structural behaviors that cannot be captured at all by linear analysis: snap-through buckling and membrane stiffening. Both are purely geometric phenomena that depend on the nonlinear relationship between deformation and stiffness.
Snap-through buckling occurs when a shallow arch or dome structure under increasing central load reaches a critical point where the arch suddenly snaps through to an inverted configuration. Linear analysis finds a smooth, monotonically increasing displacement response up to and including the snap-through point. It completely misses the snap-through itself because snap-through is a geometric instability that depends on the changing stiffness of the deforming arch, which linear analysis assumes to be constant.
Membrane stiffening (also called geometric stiffening or stress stiffening) occurs when a flexible membrane develops significant in-plane tensile stress under transverse loading, and that tensile stress contributes to the membrane’s resistance to further transverse deflection. A stretched cable or a drum skin becomes stiffer as it is loaded because the tensile load in the membrane stiffens it against transverse forces. Linear analysis, which does not account for the stiffness contributed by membrane stresses, significantly underpredicts the load-carrying capacity of these structures.
Material Nonlinearity: Beyond Hooke’s Law
Material nonlinearity matters most when the design intent is to allow controlled plastic deformation, when the structure is loaded to failure, or when the material is inherently nonlinear (rubber, elastomers, some polymers, biological tissues). For these applications, linear analysis produces results that are not just inaccurate but actively misleading because the predicted stresses exceed the yield strength without the analysis having any mechanism to redistribute the excess load through plastic flow.
In metal forming and manufacturing simulations, the entire purpose of the process is to cause plastic deformation: the blank is plastically formed into the desired shape. Linear analysis is fundamentally inapplicable. The material model must include both the elastic and plastic regions of the stress-strain curve, and the analysis must track the accumulated plastic strain as the blank progressively deforms into the die.
For structural integrity and fitness-for-service assessments of pressure vessels and piping under overload conditions, material nonlinearity is required by ASME Section VIII Division 2 when using the Direct Route to Design by Analysis. The limit load calculation, which determines the load at which the structure reaches plastic collapse, explicitly requires an elastoplastic material model with no hardening (elastic-perfectly plastic) to identify the load at which the structure can no longer maintain equilibrium without unlimited plastic flow.
Contact Nonlinearity: When Interfaces Define the Solution
Contact nonlinearity is present in virtually every assembled mechanical structure: bolted connections, press-fit interfaces, bearing contacts, snap-fit joints, rubber seals against housing surfaces, gear tooth contacts. Any interface where the contact pressure, contact area, and sliding behavior are part of the structural response rather than known inputs to the analysis requires contact nonlinearity.
The specific challenges of contact nonlinearity extend beyond the three-body problem of contact mechanics. Friction at contact interfaces introduces load-path dependence: the contact forces depend not just on the current load but on the sequence of loading, because frictional interfaces lock in shear forces that persist after the load is removed. This makes contact analysis with friction inherently history-dependent and requires incremental loading even when the final load state is static.
The Decision Framework: 12 Engineering Scenarios
The following table maps 12 common engineering analysis scenarios to the correct analysis type, the primary indicator to check, and the solver approach required. Use this as a starting reference for any new analysis before reviewing the detailed sections below.
Situation
Linear FEA Valid?
Nonlinear Type Needed
Primary Indicator
Solver Approach
Steel bracket under service load, stress < 0.7 Sy
Yes
None
Von Mises stress well below yield
Linear static
Rubber seal under compression
No
Material + geometric
Elastomeric material, large strain
Nonlinear static, hyperelastic material model
Snap-fit clip at maximum deflection
No
Geometric (large deformation)
Deflection > 5% of characteristic length
Nonlinear static, large displacement
Bolted joint assembly with preload
No
Contact nonlinearity
Parts interact and may separate
Nonlinear static with contact
Sheet metal forming simulation
No
Geometric + material + contact
Plastic yielding, large strain, die contact
Nonlinear with plasticity and contact
Post-buckling structural response
No
Geometric nonlinearity
Stiffness changes after buckling load
Nonlinear static or Riks method
Crash simulation (impact < 100ms)
No
Geometric + material + contact + dynamic
High strain rate, dynamic inertia effects
Explicit dynamic nonlinear
Vibration mode shapes of a stiff structure
Yes (modal)
None if stress < 0.5 Sy
Frequency and mode shape extraction
Linear modal analysis
Pressure vessel below design pressure (ASME Div 1)
Reading this table: the green-highlighted scenarios in the ‘Linear FEA Valid?’ column are cases where linear analysis is justified by engineering assessment. The red-highlighted scenarios require nonlinear analysis. Note that code-mandated linear analysis (ASME Div 1 pressure vessels) appears as a green case even though the actual physical behavior may include some nonlinearity, because the design code’s safety factors are calibrated for linear elastic stress analysis and a nonlinear analysis used in this code context would require a different evaluation methodology (Div 2 Direct Route).
Computational Cost of Nonlinear FEA: What You Are Actually Paying For
The decision between linear and nonlinear analysis is not purely a matter of accuracy. It is an engineering decision that includes computational cost, setup time, result interpretation complexity, and convergence risk. Understanding the computational cost multipliers of nonlinear analysis helps engineers and engineering managers make this decision with realistic expectations about the time and resources required.
Analysis Type
Solve Time (vs Linear)
Memory (vs Linear)
Iteration Method
Convergence Risk
Linear static
1x (baseline)
1x (baseline)
Direct solver, single pass
None – always converges
Linear buckling (eigenvalue)
2x-5x
1.5x-2x
Eigenvalue extraction (Lanczos)
Low – eigenvalue extraction is robust
Nonlinear static (geometric NL only)
3x-15x
1.5x-3x
Newton-Raphson incremental
Medium – diverges at snap-through points
Nonlinear static (material + geometric)
5x-30x
2x-5x
Newton-Raphson with arc-length
Medium-High – plasticity causes slow convergence
Nonlinear static (contact)
5x-50x
2x-4x
Lagrange multiplier or penalty
High – contact opening/closing causes instability
Fully nonlinear (all three types)
10x-100x
3x-8x
Newton-Raphson or explicit
Very High – requires expert setup and monitoring
Implicit nonlinear dynamic
20x-200x
4x-10x
Newmark-Beta or HHT-alpha
High – time step must meet stability requirements
Explicit nonlinear dynamic
5x-50x (per cycle)
2x-4x
Central difference (conditionally stable)
Low per step but needs very small time steps
Why Nonlinear FEA Costs So Much More
The fundamental reason nonlinear analysis is so much more expensive than linear analysis is the need for incremental, iterative solution. A linear analysis solves one matrix equation: [K]{u} = {F}. The stiffness matrix K is computed once, factored once, and the displacement vector u is computed in one back-substitution operation. The cost is dominated by the matrix factorization, which scales roughly as O(n^1.5) for sparse matrices, where n is the number of degrees of freedom.
A nonlinear analysis solves this equation many times. The load is applied in increments (typically 10 to 100 load steps), and within each load step, the solution is iterated using the Newton-Raphson method until the residual (the difference between internal and external forces) falls below a specified tolerance. Each Newton-Raphson iteration requires recomputing the tangent stiffness matrix (which has changed because the geometry or material state has changed), re-factoring it, and performing another back-substitution. A nonlinear analysis with 50 load steps and 5 Newton-Raphson iterations per step requires 250 matrix factorizations compared to the single factorization in a linear analysis.
Contact Nonlinearity: The Most Computationally Expensive Case
Contact problems are computationally the most expensive because the active contact set can change from one Newton-Raphson iteration to the next. A node that was not in contact in one iteration may come into contact in the next, changing the number of active constraints and requiring the stiffness matrix to be modified. This causes chattering: nodes oscillating between in-contact and not-in-contact states without converging, which the solver must detect and address by stabilizing the contact behavior. Different FEA solvers (Ansys, Abaqus, NASTRAN, LS-DYNA) implement contact stabilization through different algorithms (augmented Lagrangian, penalty method, Lagrange multiplier) with different stability and accuracy tradeoffs.
Explicit vs Implicit Solvers: The Dynamic Nonlinear Choice
For dynamic nonlinear problems, engineers choose between implicit solvers (Newmark-Beta, HHT-alpha, backward difference) and explicit solvers (central difference). This choice has profound consequences for both computational cost and the types of problems each can handle.
Implicit solvers are unconditionally stable: they can use large time steps without numerical instability. They require matrix factorization at each time step but can advance through time efficiently for quasi-static or low-frequency dynamic problems. They are used for slow events: forming processes, material testing, structural response to slowly applied loads, and seismic analysis of buildings.
Explicit solvers are conditionally stable: they require a time step smaller than the Courant-Friedrichs-Lewy (CFL) condition, which is approximately equal to the element’s smallest dimension divided by the wave speed in the material. For steel (wave speed approximately 5,000 m/s), a 1mm element requires a time step smaller than 0.0000002 seconds. This very small time step makes explicit solvers suitable for fast events (crash simulations, blast loading, high-speed impact) where the event itself happens in milliseconds and the time step is naturally small relative to the event duration.
The Linear Pre-Check: A Diagnostic Tool Before Committing to Nonlinear
One of the most time-efficient workflows in FEA practice is using a linear analysis as a diagnostic tool to determine whether nonlinear analysis is actually necessary. This pre-check workflow is standard practice among experienced FEA analysts but rarely documented explicitly in educational content. It avoids the expensive, time-consuming, and potentially non-converging nonlinear analysis when the structure actually behaves linearly under the given loading.
The Linear Pre-Check Workflow
Run linear static analysis: Set up the model with linear material properties, no contact (bond all interfaces initially), and small displacement assumptions. Solve and extract results.
Check maximum displacement ratio: Compute max displacement / characteristic dimension. If > 0.05, geometric nonlinearity is potentially significant.
Check von Mises stress vs yield: Identify the maximum von Mises stress. If > 0.7 x Sy at any location, material nonlinearity is potentially significant. If > Sy, it is definitely significant.
Check contact interfaces: Identify all interfaces where contact is assumed. Any interface where parts may separate or slide under load requires contact nonlinearity.
Make the decision: If none of the above thresholds are exceeded, linear analysis is adequate. If any are exceeded, proceed to nonlinear with the specific nonlinearity type identified by the pre-check results.
Run nonlinear and compare: For validation purposes, compare linear and nonlinear results on the first nonlinear analysis for a given part family. If the results agree within 5 to 10 percent, linear may be adequate for future similar analyses of that part family.
The Pre-Check Rule of Thumb Linear is likely adequate when: max displacement / characteristic dimension < 5%, max von Mises < 70% Sy, no changing contact conditions. Nonlinear is required when: any of these thresholds is exceeded, the material is a rubber or elastomer, the loading involves dynamic impact or fast transients, or the structural response involves buckling or snap-through. When in doubt: run both for one representative load case. The additional time is almost always justified by the confidence it provides in the analysis strategy.
Nonlinear FEA Convergence Troubleshooting
The single most common practical challenge in nonlinear FEA is convergence failure: the Newton-Raphson iteration does not converge within the maximum number of iterations at a specific load increment. Convergence failure is not random: it occurs at specific load levels for specific physical reasons, and understanding those reasons is the key to resolving it.
What Convergence Failure Actually Means
Convergence failure means that the solver could not find a displacement increment that reduces the residual (force imbalance) below the convergence tolerance within the maximum allowed number of iterations. This happens for three distinct reasons: the physical system is genuinely unstable at this load level (snap-through, plastic collapse), the numerical model has setup problems (poorly constrained model, inconsistent contact definitions, material model extrapolated beyond its calibrated range), or the increment size is too large for the solver to converge within the iteration limit even though the physical behavior is stable.
Convergence Troubleshooting Checklist
Nonlinear FEA Convergence Troubleshooting
STEP 1: IDENTIFY WHERE CONVERGENCE FAILS
  - Note the load increment at which convergence fails
  - Is it at first increment? -> Likely model setup problem
  - Is it at a specific load level? -> Physical or numerical issue at that load
  - Is it always at the same fractional load? -> Probably physical instability

STEP 2: CHECK FOR PHYSICAL INSTABILITY
  - At snap-through: use arc-length (Riks) method instead of N-R
  - At plastic collapse: check if load exceeds limit load (by design?)
  - At contact opening: verify contact definition, reduce increment size

STEP 3: CHECK MODEL SETUP (if fails at first increment)
  - Rigid body motion: check all DOFs are constrained
  - Overconstrained contact: verify contact pair orientation
  - Material model: verify all required properties are defined
  - Large stiffness ratio: check if material or geometry creates ill-conditioning

STEP 4: ADJUST SOLVER SETTINGS
  - Reduce load increment size (halve it, try again)
  - Increase max iterations per increment (10 -> 20 -> 30)
  - Tighten or relax convergence tolerance (try 1e-3 instead of 1e-4)
  - Enable line search (Ansys) or activate stabilization (Abaqus)
  - Switch from full N-R to modified N-R (less expensive per iteration)

STEP 5: CHECK MESH QUALITY AT CONVERGENCE FAILURE LOCATION
  - High aspect ratio elements near contact zones -> refine mesh
  - Poorly shaped elements in high-stress/high-strain regions -> remesh
  - Check for hourglassing in reduced-integration elements

STEP 6: IF STILL NOT CONVERGING
  - Plot deformed shape at last converged increment: does it look physical?
  - Review convergence plot: is residual oscillating or monotonically decreasing?
  - Consider switching from implicit to explicit solver for dynamic event
  - Consult material data: is the material model calibrated for this strain range?
Code-Mandated Analysis Types: When the Standard Decides for You
In certain regulated engineering domains, the choice between linear and nonlinear FEA is not made by the analyst based on engineering judgment: it is specified by the applicable design code. Understanding which codes mandate which analysis types is essential for engineers working in pressure vessels, nuclear, aerospace, and civil structural applications.
ASME Section VIII: Two Division Philosophy
ASME Boiler and Pressure Vessel Code Section VIII governs the design of pressure vessels in two divisions with fundamentally different analytical philosophies. Division 1 uses linear elastic stress analysis combined with stress categorization (primary, secondary, peak stresses) and prescriptive safety factors. The analysis methodology is built on linear FEA results, and the evaluation criteria are specific to linear elastic results. Using a nonlinear analysis under Division 1 methodology would produce results that cannot be directly compared to the Division 1 acceptance criteria without additional interpretation.
Division 2 offers an alternative using the Direct Route to Design by Analysis, which explicitly permits and in some cases requires nonlinear analysis. The Direct Route includes limit load analysis (elastoplastic material, load factor approach) and elastic-plastic analysis (full nonlinear analysis at factored loads) as assessment methods. An analyst using Division 2 Direct Route is explicitly expected to perform nonlinear analysis for overload and progressive plastic deformation assessments.
Aerospace and Structural Codes
Aerospace structural analysis for primary structure typically follows linear elastic analysis with knockdown factors for buckling, combined loads, and material variability. The Federal Aviation Administration (FAA) and European Union Aviation Safety Agency (EASA) structural substantiation requirements are calibrated for linear analysis methods, and nonlinear analysis may require additional justification and validation before acceptance. However, nonlinear FEA is widely used in aerospace for detailed stress analysis of fastened joints, bearing analysis, and composite damage progression, where linear analysis is insufficient to capture the physical behavior.
Q: When should I use nonlinear FEA instead of linear FEA?
Use nonlinear FEA when any of the three linear assumptions are violated: when maximum displacement exceeds 5 to 10 percent of the smallest characteristic structural dimension (geometric nonlinearity), when any location in the structure reaches or exceeds the material yield strength under service loads (material nonlinearity), or when contact conditions between parts change during loading, parts may separate or slide, or frictional forces are significant at interfaces (contact nonlinearity). As a practical shortcut: run a linear analysis first, check maximum displacement ratio and von Mises stress, and escalate to nonlinear only if the thresholds are exceeded.
Q: What is the difference between geometric and material nonlinearity in FEA?
Geometric nonlinearity (also called large displacement nonlinearity) occurs when the structure’s deformation is large enough that its stiffness changes as it deforms. The equilibrium equations must be evaluated in the deformed configuration rather than the original. Material nonlinearity occurs when the stress-strain relationship is not linear, which happens when the material yields plastically (metals above yield), when the material is inherently nonlinear even at small strains (rubber, elastomers, biological tissues), or when time-dependent effects like creep are present. Both types can occur simultaneously, and many real-world problems require both to be addressed together.
Q: How much slower is nonlinear FEA compared to linear FEA?
Nonlinear FEA is typically 5 to 50 times slower than an equivalent linear analysis for geometric and material nonlinearity alone, and 10 to 100 times slower when contact nonlinearity is included. The increase is due to the need for incremental loading (typically 10 to 100 load steps) and iterative solution within each step using the Newton-Raphson method, each iteration requiring a full matrix refactorization. Fully nonlinear analyses with all three nonlinearity types (geometry, material, contact) can require hundreds of matrix factorizations compared to the single factorization in a linear analysis.
Q: What is contact nonlinearity in FEA and when does it apply?
Contact nonlinearity occurs whenever the contact state between surfaces in an assembly changes during loading: two surfaces that are initially in contact may separate, initially separated surfaces may come into contact, or sliding occurs at a frictional interface. Any assembled mechanical structure where parts interact has potential contact nonlinearity: bolted joints, press-fit interfaces, bearing contacts, snap-fit joints, rubber seals against housings, and gear tooth contacts. Contact is computationally the most challenging nonlinearity type because the active contact set changes discontinuously during the solution, causing numerical instability that requires specialized contact algorithms to manage.
Q: What is the Newton-Raphson method in nonlinear FEA?
Newton-Raphson (N-R) is the iterative solution algorithm used in most implicit nonlinear FEA solvers. At each load increment, N-R iterates to find a displacement increment that reduces the residual (the difference between internal forces generated by the current displacement state and the externally applied forces) below a specified convergence tolerance. Each iteration requires computing the tangent stiffness matrix (which has changed from the previous iteration due to geometric or material state changes), factoring it, and computing a new displacement estimate. Convergence is achieved when the residual norm falls below the tolerance, typically 0.1 to 1 percent of the applied force norm. N-R convergence can fail if the load step is too large or if the physical system is genuinely unstable.
Q: Can I use linear FEA for buckling analysis?
Linear eigenvalue buckling analysis (Euler buckling) is valid for predicting the critical load at which a structure first loses stability, but it provides no information about the post-buckling behavior. If the structure is expected to carry load beyond the buckling point (shell buckling in aerospace structures, for example), or if imperfections significantly affect the buckling load (which they do for most real structures), nonlinear geometric analysis including initial geometric imperfections is required. The standard approach is to use linear eigenvalue buckling to identify the critical load and mode shape, then use the mode shape as an initial geometric imperfection for a nonlinear post-buckling analysis to determine the actual structural response.
Q: What does convergence failure in nonlinear FEA mean?
Convergence failure in nonlinear FEA means that the Newton-Raphson iterative solver could not find a displacement increment that reduces the force residual below the convergence tolerance within the maximum allowed number of iterations. This can indicate physical instability (the structure has reached a snap-through point, plastic collapse limit, or contact instability), model setup problems (unconstrained rigid body motion, poorly defined contact, material model extrapolated beyond its calibrated range), or numerical issues (increment size too large, mesh quality problems in high-strain regions). Troubleshooting begins by identifying the load level at which convergence fails and examining the deformed shape at the last converged increment to determine whether the failure is physical or numerical.
Conclusion:
The correct answer to when to use linear versus nonlinear FEA is not a preference for one approach over the other. It is a question answered by assessing three specific physical conditions against three specific thresholds, and choosing the analysis type that correctly captures the physical behavior that will govern the structural response under the loading conditions of interest.
Linear FEA is not a compromise or a shortcut when it is appropriate: it is the theoretically correct analysis for structures where all three linearity assumptions hold. The computational efficiency, the certainty of convergence, and the straightforward interpretation of results are properties of a correctly applied analysis, not concessions made to save time. Nonlinear FEA is not universally more accurate than linear FEA: it is more accurate for problems where the physical nonlinearity is present and significant, and it is equivalent to or marginally different from linear FEA for problems where it is not.
The engineering skill is the assessment: using the pre-check workflow to identify which thresholds are exceeded, understanding which type of nonlinearity dominates, selecting the appropriate nonlinear analysis type and solver approach, and knowing how to diagnose convergence problems when they arise. These skills are what separate an FEA practitioner who gets correct results efficiently from one who either misses real nonlinear behavior or spends excessive resources on nonlinear analyses for inherently linear problems.