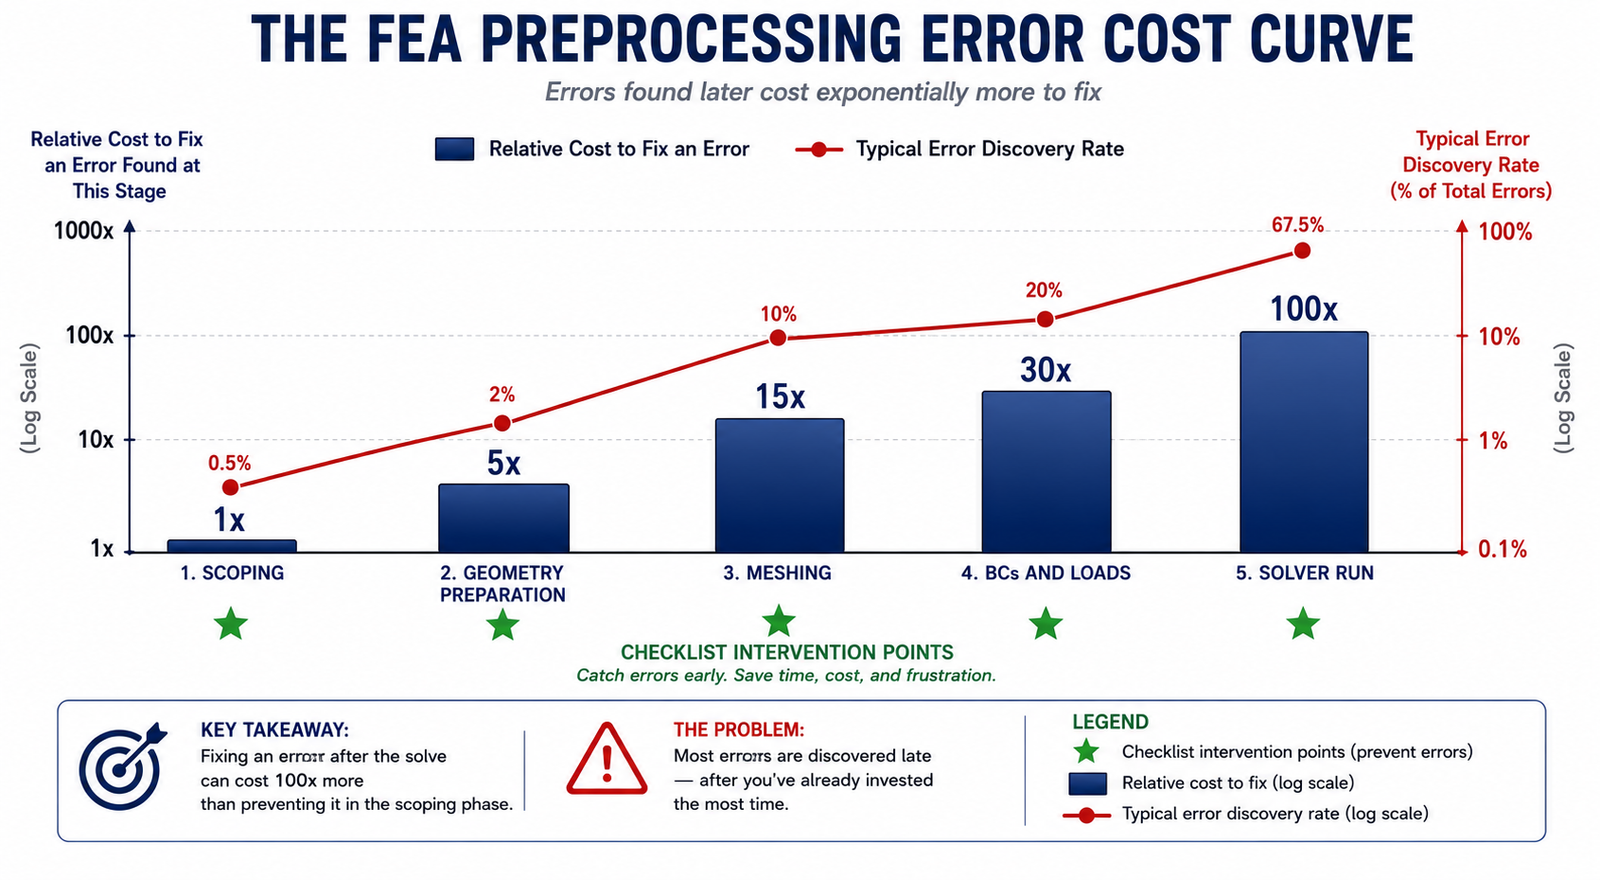
The analysis had taken fourteen hours to run on the HPC cluster. The stress contours looked reasonable at first glance, the colors were plausible, the deformation shape made sense, and the peak stress value was within the expected range. But when the engineer tried to verify the result against a hand calculation for a simplified version of the geometry, the numbers didn’t match. After two hours of investigation, the problem surfaced: the material density had been entered as 7850 kg/m³ in a model where the geometry was defined in millimeters.
The mass matrix was wrong by a factor of 10⁹. The natural frequencies from the modal analysis were off by a factor of 31,623. Every dynamic result in the analysis was meaningless.
Unit mismatches are one of the most common FEA preprocessing errors, and one of the least obvious, because the stress results from a static analysis are often unaffected by density errors and look completely normal. The error only manifests in dynamic results, and only if the analyst checks them against an independent reference. Without the hand calculation cross-check, the wrong results would have been reported as correct. This is the defining characteristic of preprocessing errors: they do not produce error messages. The solver runs, the results appear, and the output looks like a valid FEA result. The only thing that reveals the error is a systematic check of every preprocessing decision, which is exactly what a preprocessing checklist provides.
This article presents a 30-point FEA preprocessing checklist covering the six categories where preprocessing errors most commonly occur: analysis scoping, geometry preparation, material assignment, element selection, mesh quality, boundary conditions and loads, and analysis settings. Each checklist item identifies the failure mode it prevents, its priority, and what to do when the check fails. The article also includes four reference tables: geometry cleanup decisions, element type selection, mesh quality metrics with acceptable ranges, and unit system compatibility. Used before every analysis run, this checklist catches the errors that fourteen-hour solver runs cannot.
The 30-Point FEA Preprocessing Checklist
The following checklist covers every preprocessing decision category. Items marked Critical will produce wrong results or solver failure if skipped. Items marked High introduce significant accuracy risk. Items marked Medium are good practice that prevents post-processing problems. Work through the checklist in order, the categories are sequenced so that early errors are caught before time is invested in later steps that depend on them.
| # | Checklist Item | Category | Failure Mode if Skipped | Priority |
| 1 | Confirm analysis objective and required output quantities | Scoping | Wrong element type, mesh density, or analysis type selected for the question being asked | Critical |
| 2 | Identify all load cases and combinations | Scoping | Critical load combinations missed; non-governing cases consume compute time | Critical |
| 3 | Define required accuracy and acceptable error tolerance | Scoping | Over-meshing (wasted time) or under-meshing (wrong results) with no basis for judgment | Critical |
| 4 | Simplify CAD geometry, remove non-structural features | Geometry | Mesh generation fails or produces poor-quality elements at fillets, logos, and cosmetic features | Critical |
| 5 | Verify geometry units and scale | Geometry | Stress results in wrong units by 3 to 6 orders of magnitude; deformation looks wrong but error is not obvious | Critical |
| 6 | Check for geometry gaps, overlaps, and duplicate surfaces | Geometry | Mesh generation creates unconnected regions or double elements; load transfer fails silently | Critical |
| 7 | Confirm midsurface extraction for thin-walled parts (shell models) | Geometry | Shell model offset by half-thickness; contact and load application on wrong face | High |
| 8 | Assign correct material properties, E, nu, density, yield stress | Materials | All stress results wrong by the ratio of correct to incorrect modulus | Critical |
| 9 | Verify material property units match model units | Materials | Same as above, unit mismatch produces results that are plausible but wrong | Critical |
| 10 | Confirm material direction for orthotropic / anisotropic materials | Materials | Composite or wood material loaded in wrong principal direction; stiffness 5-50x wrong | Critical |
| 11 | Select correct element type for the physics | Elements | Shell elements for thick sections (t/L > 0.1) give wrong results; solid elements for thin shells miss bending | Critical |
| 12 | Use quadratic elements where stress gradients are important | Elements | Linear elements underestimate peak stress at notches and fillets by 20-50% | High |
| 13 | Check element aspect ratio, target < 5:1, never exceed 10:1 | Mesh Quality | High-aspect elements produce large discretization errors and ill-conditioned stiffness matrix | Critical |
| 14 | Check Jacobian ratio, all elements above 0.6 | Mesh Quality | Negative Jacobian elements cause solver failure; low Jacobian degrades accuracy | Critical |
| 15 | Verify element warpage angle < 10 degrees for quads and hexahedra | Mesh Quality | Warped elements introduce mapping errors that degrade stress accuracy | High |
| 16 | Confirm mesh density at stress concentrations (8+ elements per radius) | Mesh Quality | Peak stress at notches, holes, and fillets under-predicted; safety factors non-conservative | Critical |
| 17 | Run mesh convergence study at critical locations | Mesh Quality | Results are mesh-dependent; no basis for trusting the stress answer | Critical |
| 18 | Verify node connectivity at interfaces, no gaps between parts | Mesh Quality | Load transfer fails between components; artificial stress concentration at interface | Critical |
| 19 | Apply correct boundary conditions, constrain exactly the physical DOFs | Boundary Conditions | Over-constraint adds artificial stiffness; under-constraint causes rigid-body motion and solver failure | Critical |
| 20 | Eliminate all rigid-body modes, run modal pre-check | Boundary Conditions | Singular stiffness matrix; solver fails or returns meaningless large displacements | Critical |
| 21 | Apply symmetry BCs correctly, verify DOF assignments for symmetry vs antisymmetry | Boundary Conditions | Antisymmetric load on symmetric BC gives completely wrong stress distribution | High |
| 22 | Define contact pairs with correct formulation and friction | Boundary Conditions | Contact interpenetration or artificial separation; load path incorrect through contact | High |
| 23 | Apply loads in correct direction, magnitude, and distribution | Loads | Stress result wrong by up to 100% if load direction or distribution is incorrect | Critical |
| 24 | Verify load units match model units | Loads | Loads off by 3-6 orders of magnitude; results look wrong but error source is not obvious | Critical |
| 25 | Check gravity direction and magnitude if self-weight is included | Loads | Self-weight applied in wrong direction; upward gravity produces tension in horizontal members | High |
| 26 | Confirm pressure load sign convention, inward vs outward positive | Loads | Pressure vessel analyzed in tension instead of compression or vice versa | High |
| 27 | Verify load application point matches physical load introduction | Loads | Stress concentration artifact at load application node; Saint-Venant region pollutes result | High |
| 28 | Confirm analysis type matches load character, static vs dynamic | Analysis Settings | Static analysis misses resonance amplification; DAF up to 50x at resonance | Critical |
| 29 | Set nonlinear analysis controls, convergence criteria and step size | Analysis Settings | Nonlinear analysis diverges or gives false convergence at wrong equilibrium state | High |
| 30 | Request correct output quantities, reactions, stress invariants, energy | Analysis Settings | Critical output not available post-solve; rerun required | Medium |
| HOW TO USE THIS CHECKLIST Print or keep this checklist open during model setup. Check off each item as it is verified, not as it is set up. There is a difference: setting up a material property is not the same as verifying it against the source datasheet. Setting up a boundary condition is not the same as confirming it matches the physical support behavior. The checklist should be completed by someone reviewing the model setup, not exclusively by the person who built it. Peer review of preprocessing catches errors that the original analyst has become blind to through familiarity with their own setup. |

Category 1: Analysis Scoping, Define the Question Before Building the Model
The most expensive preprocessing error is building the wrong model, one that answers a question the engineer did not actually need answered, or one that is missing the output quantities required for the design decision. Analysis scoping establishes what question the FEA must answer, what accuracy is required, what load cases must be covered, and what outputs must be extracted. Every subsequent preprocessing decision, geometry simplification level, element type, mesh density, analysis type, flows from the scoping decisions. Getting scoping wrong means every downstream decision is potentially wrong too.
Checklist Item 1: Confirm the Analysis Objective
Before opening the preprocessing software, write down in one or two sentences exactly what question this FEA analysis is answering. ‘Determine if the bracket will fail’ is not sufficient. ‘Determine the maximum von Mises stress in the bracket under the 5000 N vertical load applied at the tip, and compare it to the yield stress of 350 MPa with a safety factor target of 1.5’ is a complete objective. The objective must specify: the physical quantity of interest (stress, displacement, natural frequency, heat flux), the location of interest (specific feature, maximum over whole model, or both), the load case or cases, and the acceptance criterion.
The analysis objective determines the required fidelity of every subsequent decision. If the objective is to predict whether a part yields under a specified load, a linear static analysis with von Mises stress output is appropriate. If the objective is to predict fatigue life at a specific joint, the analysis requires principal stress amplitude extraction at the joint, a fatigue notch factor, and an S-N curve, inputs that cannot be extracted if they were not set up before the solve. Setting up the output requests before the solve is part of preprocessing, not postprocessing
Checklist Item 2: Identify All Load Cases
A complete load case definition includes all combinations of loads that the structure will experience during its service life, not just the peak load case. Missing a load combination is one of the most consequential scoping errors because the governing load case is not always the one with the largest magnitude. A thermal load combined with a modest mechanical load can produce higher stress at a critical location than the peak mechanical load alone, because the thermal stress adds to the mechanical stress with the same sign in one direction and subtracts in another.
For fatigue analyses, the complete load history, not just the peak load, must be defined at scoping. The fatigue damage accumulated at a specific stress amplitude depends on the number of cycles at that amplitude, which requires the full load spectrum. A fatigue analysis scoped only to the peak load will miss the contribution of lower-amplitude, higher-cycle portions of the load spectrum that may dominate fatigue life for high-cycle applications in the Basquin (power law) regime.
Category 2: Geometry Preparation, The Most Time-Consuming Category
Geometry preparation, cleaning, simplifying, and repairing the CAD model for FEA use, is typically the most time-consuming phase of preprocessing, often consuming 40 to 60 percent of total analysis setup time. It is also the category where the cost of poor preparation compounds most severely: bad geometry produces bad meshes, bad meshes produce wrong results, and the error propagation is not always obvious. A systematic geometry cleanup using the decision table below prevents the most common mesh generation failures and result accuracy problems.
| CAD Feature | Why It Causes Problems | Cleanup Action | When to Keep It |
| Cosmetic chamfers and edge breaks (< 0.5mm) | Mesh generator creates distorted elements to capture tiny geometry; massively increases element count for zero structural benefit | Suppress or remove in preprocessing | Never, below 0.5mm, chamfers have no structural effect; include only in models where surface finish matters for fatigue |
| Logos, text, and embossed markings | Non-planar surface features cause mesh generation to fail or create highly distorted elements on otherwise flat faces | Suppress all decorative surface features | Never for structural FEA, if appearance matters, keep in visualization model only |
| Standard hardware (bolts, washers, nuts) | Full bolt thread geometry requires millions of elements to mesh; threads add no load-transfer accuracy vs simplified bolt shank model | Replace with simplified cylinder or beam element for bolt shank; apply preload as force | Only when thread failure is the specific analysis objective, and only model the thread root zone |
| Fillets on non-critical features (not in load path) | Prevent automatic hex meshing; force tet mesh in regions that do not affect results | Suppress non-load-path fillets; keep only fillets at stress concentration locations | All load-path fillets must be retained, stress concentration at load-path fillet is a primary analysis objective |
| Thin slivers and short edges | Mesh generator creates needle elements along sliver; element quality fails checks; solver struggles | Merge or remove sliver surfaces; heal short edges to adjacent surfaces | Never, slivers are modeling artifacts, not structural features |
| Duplicate or overlapping surfaces | Mesh generates double elements at same location; load applied twice; stiffness doubled artificially | Delete duplicates; use geometry repair tools to merge coincident surfaces | Never, duplicates are geometry import errors with no structural meaning |
| Holes below mesh-size threshold | Tiny holes create mesh singularity zones and do not affect structural response | Suppress holes whose diameter is less than one-quarter of the local mesh size target | Only when fluid passes through the hole (CFD coupling) or when the hole is at a stress concentration location under study |
| Assembly gaps and mismatches at interfaces | Mesh creates unconnected nodes at interface; load transfer fails silently; no error message | Use CAD repair to close gaps below 0.1mm; use mesh tie or bonded contact for designed clearances | Never, interface gaps are geometry preparation errors that must be resolved before meshing |
Checklist Item 5: Units and Scale Verification
The unit system used in the FEA model must be consistent across all inputs: geometry dimensions, material properties, load magnitudes, and output requests must all use the same units. There is no automatic unit conversion in most FEA preprocessors, if the geometry is in millimeters and the material stiffness is entered in GPa (N/m² × 10⁹), the effective stiffness in the model is off by a factor of 10⁹ and all displacements are wrong by that factor.
The most common unit conflict in industrial FEA is between geometry (typically in millimeters for manufactured parts) and material density (often entered in kg/m³ from material datasheets). In a millimeter-Newton-tonne unit system, stress comes out in MPa naturally, but density must be in tonnes per cubic millimeter (t/mm³), for steel, this is 7.85 × 10⁻⁹ t/mm³, not 7850 kg/m³. Entering the datasheet value directly produces a mass matrix that is 10¹² times too large, making all frequency and inertia results completely wrong while leaving static stress results unchanged.
Unit System Quick Reference, Steel Properties in Common FEA Unit Systems |
Category 3: Material Properties, Verified Against Source Data
Material property errors are insidious because they affect every result in the analysis by a fixed multiplier, but that multiplier is often not obvious. A Young’s modulus entered as 200,000 instead of 210,000 MPa (a 5 percent error from misreading the datasheet) produces stress results that are 5 percent wrong everywhere in the model, a systematic error that no mesh refinement or convergence study will reveal, because the physics is internally consistent at the wrong material stiffness.
The Five Material Properties That Must Be Source-Verified
- Young’s modulus (E): Primary determinant of displacement and stress under mechanical load. Verify against the material standard (ASTM, EN, JIS) for the specific alloy and temper, not a generic value from memory. E varies by up to 10 percent across aluminum alloys and up to 5 percent for steel alloys in different heat treatment conditions.
- Poisson’s ratio (ν): Affects lateral strain and stress in multiaxial stress states. For most metals: 0.27 to 0.33. For rubber and elastomers: approaching 0.5. For composites: highly direction-dependent. Using ν = 0.3 for all metals is acceptable for most structural analyses but introduces up to 10 percent error in highly constrained 3D stress states.
- Density (ρ): Required for dynamic analysis, self-weight calculation, and inertia relief. Must be in model units. Verify the unit system before entry. A density of 7850 means very different things in SI (kg/m³, correct for steel) and mm-tonne (t/mm³, which would be 10⁹ times too large).
- Yield stress (S_y) and ultimate tensile stress (S_u): Required for nonlinear analysis and safety factor calculation. Must match the specific alloy, temper, and product form (plate, bar, forging), yield stress for a 6061-T6 plate is 276 MPa; for 6061-T651 it is 276 MPa; for 6061-O (annealed) it is 55 MPa. Using the wrong temper value can underestimate or overestimate yield by a factor of 5.
- Thermal expansion coefficient (α): Required for thermal stress analysis. For steel: 11 to 13 × 10⁻⁶ /°C. For aluminum: 22 to 24 × 10⁻⁶ /°C. Using the wrong value in a thermal stress analysis produces proportionally wrong thermal stress, a 10 percent error in α produces a 10 percent error in thermal stress.
Orthotropic and Composite Material Direction Verification
For orthotropic materials (composites, timber, rolled plate with directional properties), the material principal directions must be correctly aligned with the geometry coordinate system. An FEA solver applies material stiffness in the directions defined by the material coordinate system. If the fiber direction of a CFRP laminate is defined as the global X direction but the part is oriented so that the fibers run in the Y direction, the axial stiffness (fiber direction, E ~ 150 GPa) and transverse stiffness (matrix direction, E ~ 8 GPa) are swapped. The model is 18 times too flexible in the load direction and 18 times too stiff transversely, an error that no amount of mesh refinement or solver accuracy will correct.
The verification step for orthotropic material direction: apply a unit displacement in the material’s primary fiber direction and confirm that the reaction force corresponds to the fiber-direction modulus. Then apply the same unit displacement in the transverse direction and confirm the transverse modulus. If either check fails, the material coordinate system is incorrectly defined.
Category 4: Element Type Selection, Matching Physics to Formulation
Element type selection is one of the highest-leverage preprocessing decisions. The wrong element type can introduce errors of 20 to 200 percent in peak stress results, larger than almost any mesh density error, while the right element type produces accurate results even with a relatively coarse mesh. The selection must be based on the geometry’s dominant structural behavior: does the structure primarily bend as a thin shell, stretch as a solid body, or carry axial loads as a slender member? Each behavior has an optimal element type, and using a suboptimal type means the element’s mathematical formulation is fighting the physics it is trying to represent.
| Geometry Type | Recommended Element | Order | When to Avoid | Key Check |
| Thin-walled structure (t/L < 0.05) | Shell (QUAD4 / QUAD8) | Quadratic (QUAD8) preferred | When through-thickness stress gradient matters; when contact on curved surface | Midsurface offset correct; thickness assigned correctly; stacking direction for composites |
| Moderately thin wall (0.05 < t/L < 0.1) | Shell or solid, run sensitivity | Quadratic for both | Solid with only 1-2 elements through thickness gives wrong bending stiffness | If solid: at least 3 elements through thickness for bending accuracy |
| Solid 3D part, regular geometry | Hexahedral (HEX8 / HEX20) | Quadratic (HEX20) for stress | Avoid where geometry prevents structured hex mesh, distorted hex is worse than good tet | Aspect ratio < 5:1; Jacobian > 0.6; warpage < 10 degrees |
| Solid 3D part, complex geometry | Tetrahedral (TET10) | Quadratic (TET10) always, never TET4 for stress | TET4 (linear tet) for stress analysis, 4-10x under-predicts peak stress vs TET10 | Sufficient density at stress risers; convergence study mandatory for TET10 models |
| Slender beam or frame member (L >> cross-section) | Beam (BEAM2 / BEAM3) | Quadratic (BEAM3) for bending | When cross-section stress distribution matters (not just resultant force and moment) | Section properties correctly defined; neutral axis at correct location; shear center |
| Springs, cables, and 1D connectors | Spring / Truss / RBE | Not applicable | When flexural stiffness matters, spring and truss carry axial force only | Stiffness value in correct units; DOF connections correct for spring type |
| Axisymmetric geometry and loading | Axisymmetric solid (AXISYM) | Quadratic preferred | When load breaks axisymmetry, use 3D model | Geometry on correct side of axis; loading defined in meridional plane |
| Plane stress (thin plate in-plane) | Plane stress quad (CPS8) | Quadratic | When thickness is not small compared to in-plane dimensions | Out-of-plane stress is zero by assumption, verify this is physically correct |
The Linear vs Quadratic Element Decision
Within each element family, the choice between linear (first-order) and quadratic (second-order) elements is consistently one of the most impactful decisions in preprocessing. Linear elements (TET4, HEX8, QUAD4) have displacement fields that are linear within each element, they cannot represent curved displacement fields without using very fine meshes. At stress concentration locations (notches, holes, fillets), where the stress gradient changes sharply over a short distance, linear elements significantly underestimate the peak stress because they cannot capture the curvature of the displacement field with coarse meshes.
Quadratic elements (TET10, HEX20, QUAD8) have midside nodes and displacement fields that can capture quadratic variation within each element. At stress concentrations, quadratic elements predict peak stresses 20 to 50 percent closer to the converged value with the same number of elements as linear elements. The computational cost per element is approximately 3 to 5 times higher for quadratic elements (more degrees of freedom, larger element stiffness matrices), but the accuracy gain typically more than compensates, fewer elements are needed to achieve the same accuracy, so the total model size is often smaller for a quadratic model than for a linear model at equivalent accuracy.
The specific case where linear elements are preferred over quadratic: explicit dynamics crash and impact analysis. Explicit dynamics solvers use lumped mass matrices for computational efficiency, and quadratic elements with midside nodes produce mass matrices that can cause oscillation instabilities in explicit integration. Most crash simulation codes (LS-DYNA, Abaqus Explicit) use QUAD4 shell elements and HEX8 solid elements as their primary element types for this reason. The very fine mesh required for crash simulation (element sizes of 3 to 10 mm for vehicle crash models) provides the accuracy that would otherwise require quadratic elements.
Category 5: Mesh Quality, Quantitative Acceptance Criteria
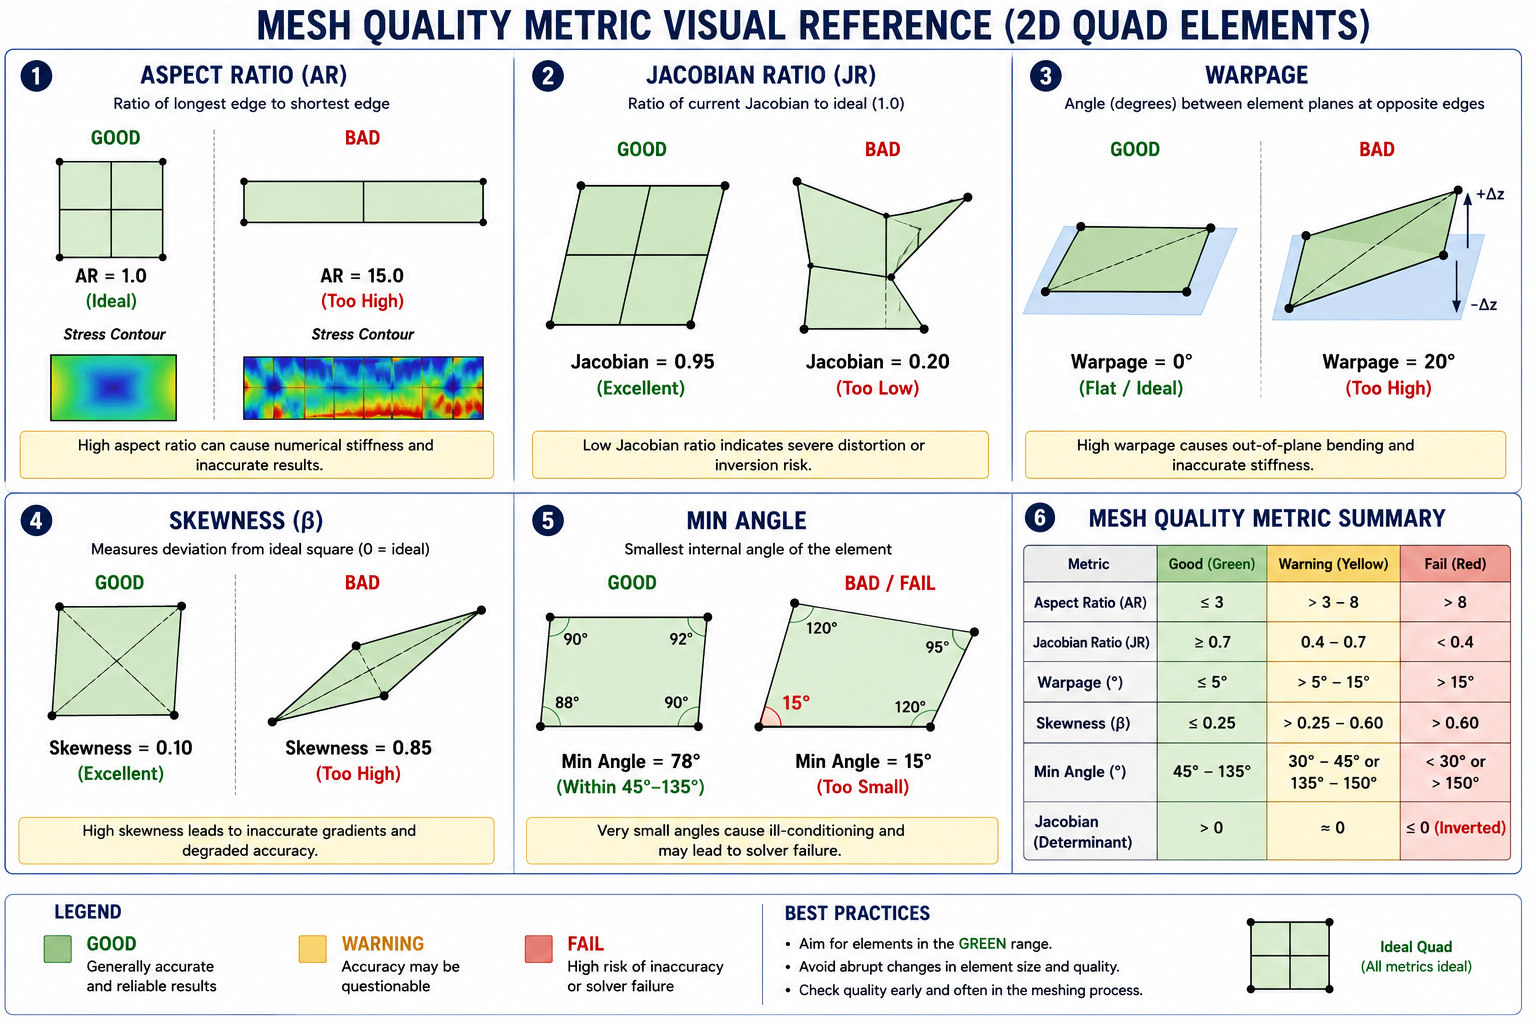
Mesh quality is the preprocessing category with the most objective criteria, unlike geometry simplification or boundary condition selection, mesh quality can be measured numerically and compared against established thresholds. Every commercial FEA preprocessor provides mesh quality metrics as standard output. The analyst’s job is to run the quality check, identify the elements that fail the acceptance criteria, and improve the mesh in those regions before running the analysis. Running a stress analysis with known poor-quality elements is not a defensible engineering practice, the solver will run, the results will look like results, and the errors introduced by the bad elements will be invisible in the output.
| Metric | Definition | Target (Good) | Warning Threshold | Failure Threshold | Fix Strategy |
| Aspect Ratio | Longest edge / shortest edge of element | < 3:1 | 3:1 to 5:1, acceptable in low-gradient regions | > 10:1, significant accuracy loss | Refine mesh in elongated direction; use smaller elements near high-gradient regions |
| Jacobian Ratio | Ratio of minimum to maximum Jacobian determinant within element | > 0.8 (ideal = 1.0) | 0.6 to 0.8, monitor accuracy | < 0.4, severe accuracy degradation; < 0 solver failure | Smooth mesh; reduce element distortion at curved boundaries |
| Warpage Angle | Angle between the two triangles formed by splitting a quad element | < 5 degrees | 5 to 10 degrees, acceptable for low-stress regions | > 15 degrees, significant mapping error in curved shells | Use smaller elements; improve surface mesh; remesh curved shell regions |
| Skewness | Deviation of internal angles from ideal (90 deg for quad, 60 deg for tri) | < 0.5 (0 = perfect) | 0.5 to 0.7, borderline | > 0.85, inaccurate; > 0.95 solver may fail | Adjust mesh seed points; use size controls to improve transition |
| Orthogonality | Angle between element face normal and centroid-to-centroid vector (CFD) | > 0.15 (1 = perfect) | 0.05 to 0.15, may affect convergence | < 0.01, CFD solver diverges | Remesh boundary layer; improve mesh at concave geometry |
| Tet Collapse Ratio | Height of tet from base / base edge length | > 0.2 | 0.1 to 0.2, borderline | < 0.1, near-degenerate tet; accuracy severely degraded | Increase local mesh density; use size controls to prevent sliver tets |
| Min/Max Angle (Tri) | Internal angles of triangular elements | 45 to 90 degrees | 30 to 120 degrees, acceptable | < 15 degrees or > 150 degrees, severe accuracy degradation | Remesh region; use advancing front mesher with angle controls |
| Min/Max Angle (Quad) | Internal angles of quadrilateral elements | 70 to 110 degrees | 45 to 135 degrees, acceptable | < 30 degrees or > 150 degrees, severe distortion | Smooth mesh topology; split distorted quads into tris if necessary |
Checklist Item 16: Mesh Density at Stress Concentrations
The most consequential mesh density decision is the element size at stress concentration locations, notches, holes, fillets, and geometric discontinuities where the stress gradient is steepest. The standard guidance is at least 8 elements spanning the fillet radius circumferentially for capturing the stress concentration factor Kt to within 5 percent of the converged value. For very small radii (r < 1mm) in a large assembly model, this requires a local mesh refinement zone at the feature.
The verification for mesh density at stress concentrations is the mesh convergence study: run the analysis at three successive mesh densities (coarse, medium, fine) at the critical location, and confirm that the peak stress at the critical location changes by less than 2 percent between the medium and fine meshes. If it changes by more, the medium mesh is not converged and the fine mesh is the minimum acceptable density. If the coarse-to-medium change exceeds 10 percent, the coarse mesh is too coarse to provide even a rough estimate.
Checklist Item 18: Node Connectivity at Interfaces
In assemblies with multiple parts, the mesh connectivity at part interfaces is a common source of silent errors. If two parts share a surface (bonded contact, tied interface, or merged nodes), the mesh nodes on the two sides of the interface must be either coincident and merged (for perfect bonding) or correctly defined as a contact pair (for frictional, frictionless, or tied contact). An interface where the meshes are not connected and no contact pair is defined is an invisible gap, the two parts can interpenetrate without load transfer, the solver does not report an error, and the stress result near the interface is meaningless.
The diagnostic for unconnected interfaces: after meshing, inspect the interface visually using a cross-section cut through the interface region. In the preprocessor’s display, connected nodes appear as a continuous mesh; disconnected nodes show two separate mesh boundaries facing each other. Alternatively, apply a small compressive load perpendicular to the interface and check that load is transferred, if the reaction at the far end of the second part shows zero force, the interface is not transmitting load.
Category 6: Boundary Conditions and Loads, The Last Line Before the Solve
Boundary conditions and loads are covered in depth in the dedicated article on FEA boundary condition selection. The preprocessing checklist focuses on the verification steps that confirm what has been set up is correct, not just present. A boundary condition that has been applied to the wrong face, in the wrong direction, or with the wrong constraint type is as wrong as a missing boundary condition, but it produces results that look more plausible and are therefore harder to catch.
Checklist Item 20: The Modal Pre-Check for Rigid-Body Modes
Before running any static or dynamic analysis, run a free-vibration modal analysis requesting the first 12 modes with no preload and no inertia relief. Any mode with a near-zero natural frequency (below 1 Hz for a structural model) is a rigid-body mode, evidence that the boundary conditions have not removed all six rigid-body degrees of freedom. A correctly constrained 3D model returns exactly zero near-zero-frequency modes from this check.
The modal pre-check takes seconds to run and definitively identifies under-constrained models before the full analysis is attempted. It is the single most efficient quality gate in the preprocessing workflow, and it should be a mandatory step before every structural analysis run, regardless of how confident the analyst is in the boundary conditions. Over-constraint (too many BCs) is not caught by this check, it requires inspection of reaction forces after the solve, but under-constraint (the more catastrophic error) is always caught.
Checklist Items 23-27: Load Verification Protocol
Load verification follows a four-step protocol: magnitude, direction, distribution, and unit confirmation. Each step is independent and each can fail independently. A load that is correct in magnitude and direction but applied to the wrong area produces a stress result that is wrong by the ratio of correct to incorrect application area. A pressure load correct in magnitude and area but in the wrong direction (inward instead of outward) produces a structure in compression where the analysis intended tension, potentially inverting the sign of every stress result in the model.
- Magnitude: Confirm the numerical value matches the load specification. Check whether the specification gives peak, mean, or RMS value, and whether the FEA load should be the instantaneous peak or a time-averaged value.
- Direction: Confirm the load direction vector in the model coordinate system. For loads defined in a local coordinate system, confirm the local system is oriented correctly. Gravity direction is a particularly common error: gravity in the negative Z direction for a model where Z is vertical, but negative Y if Y is vertical in the model coordinate system.
- Distribution: Confirm whether the load is a point force, uniformly distributed pressure, linearly varying pressure, or body force. A point force applied to a single node produces a stress singularity at that node; a distributed pressure over the correct area gives physically meaningful stress.
- Units: Confirm load units match the model unit system. A force of 5000 N in an SI model is correct; the same value in an mm-N model is also 5000 N. But a pressure of 5 MPa is 5 N/mm² in mm units and 5,000,000 Pa in SI, the same numerical value means completely different physical loads in different unit systems.
Unit System Reference: The Most Common Source of Silent Preprocessing Errors
Unit system inconsistency is the most common source of FEA errors that pass through the solver without triggering any error or warning messages. The model solves, the results look plausible, and the error is only discovered when results are compared against a hand calculation or a physical test. The unit reference table below covers the five unit systems most commonly encountered in industrial FEA, with the correct property values for steel in each system as a verification reference.
| Unit System | Length | Force | Mass | Stress / Pressure | Density | Common In |
| SI | m | N | kg | Pa (N/m^2) | kg/m^3 | Academic, European engineering, most FEA defaults |
| SI (mm-N) | mm | N | t (tonne) | MPa (N/mm^2) | t/mm^3 | Most common in industrial FEA, stress directly in MPa |
| SI (mm-kg) | mm | N | kg | MPa | kg/mm^3 | Sometimes used, CAUTION: density must be in kg/mm^3 (steel = 7.85e-6) |
| Imperial | in | lbf | slug | psi (lbf/in^2) | slug/in^3 | US aerospace and legacy codes; stress in psi |
| CGS | cm | dyne | g | dyne/cm^2 | g/cm^3 | Rarely used in FEA; some academic codes |
| THE UNIT SYSTEM VERIFICATION TEST, RUN THIS BEFORE EVERY ANALYSIS Create a simple test geometry: a 1x1x1 unit cube of the target material. Apply a 1-unit force (1 N, or 1 lbf in imperial) to one face, fixed at the opposite face. The expected axial displacement is F/(E*A) = 1/E in model length units. For steel in mm-N-t: delta = 1/210000 = 4.76e-6 mm. Run the modal analysis of the same free-free cube, the first acoustic frequency should be consistent with the wave speed in steel (approximately 5100 m/s or 5.1 mm/us) and the cube dimension. If either check fails, the unit system is inconsistent and must be corrected before the real model is run. This test takes five minutes and has saved analysts from reporting results that are wrong by factors of 10^3 to 10^9. |
The Pre-Solve Final Review: Five Minutes That Prevent Fourteen-Hour Reruns
Before submitting the analysis for solution, especially before committing to a long HPC run, a five-minute final review of the complete model setup catches the errors that individual checklist items can miss. This review is distinct from the checklist: it looks at the model as a whole rather than individual items, checking for logical consistency across all preprocessing decisions.
The Five-Point Final Review
- Render the model geometry in the preprocessor and visually inspect it: Does the geometry look correct? Are there obviously missing or duplicated parts? Is the scale plausible, does a 100mm bracket look like a 100mm bracket? Visual inspection at this stage catches geometry import errors, incorrect CAD simplifications, and unit scaling errors that result in geometry that is the right shape but the wrong size.
- Display boundary conditions and loads on the model: Most preprocessors can display BC symbols (arrows for constraints, pressure arrows for loads) on the model geometry. Confirm that constraint arrows appear at the correct faces and in the correct directions. Confirm that load arrows appear at the correct faces, with the correct magnitude and direction. A BC applied to the wrong face is immediately visible in this display; a missing BC shows as an unadorned face where an arrow should appear.
- Check the element type and material assignment for every part: In assembly models with multiple parts, it is easy to assign the wrong material or element type to one component. Review the material and element assignment list in the preprocessor and confirm that every part has the correct assignment. Parts with no material assigned are particularly dangerous, some preprocessors use a default material silently rather than flagging the omission.
- Confirm the analysis type and output requests: Verify that the analysis type (linear static, nonlinear, modal, harmonic, transient) matches the physics of the problem. Confirm that the requested outputs include all quantities needed for the design decision: at minimum, stress tensor components or principal stresses, displacements, and reaction forces. If fatigue life, strain energy, or frequency response is needed, confirm those outputs are explicitly requested before the solve.
- Estimate expected results from a hand calculation: Before submitting the job, compute an expected order of magnitude for the peak displacement and peak stress using a simplified hand model (beam theory, thin-wall pressure vessel, etc.). Write down the expected values. After the solve, compare the FEA result against this estimate. Agreement within 20 to 30 percent confirms that the physics is being modeled correctly. A factor-of-10 disagreement indicates a preprocessing error that must be investigated before the results are used.
Frequently Asked Questions
Q: What is the most common FEA preprocessing error?
The most common preprocessing error, measured by frequency of occurrence in industrial FEA practice, is unit system inconsistency, specifically, entering material density in SI units (kg/m^3) in a model whose geometry is defined in millimeters. This error does not affect static stress results (density does not enter the static equilibrium equation) and produces no error message, so it passes through the solver undetected.
The error only appears in dynamic analysis results (natural frequencies, inertia forces, self-weight) which are wrong by a factor equal to the square root of the density error ratio. The fix is a simple unit system verification test run before any dynamic analysis: apply a known load to a unit cube of the material and verify the displacement, then run a modal analysis and verify the fundamental frequency.
Q: How many elements do I need at a stress concentration?
The minimum for reliable stress concentration factor prediction is 8 elements spanning the fillet radius circumferentially, using quadratic elements (TET10, HEX20, or QUAD8). This density typically predicts the peak stress within 5 percent of the converged value for most fillet geometries. For sharp notches with root radii below 0.5mm, 12 to 20 elements across the radius may be needed, and a mesh convergence study is mandatory. The convergence criterion: the peak stress at the stress concentration should change by less than 2 percent between successive mesh refinements (coarse to medium to fine) before the result is accepted. Do not rely on the absolute element count, verify convergence by running the study.
Q: Should I use TET4 or TET10 elements for solid parts?
Always use TET10 (quadratic tetrahedral) elements for solid parts where stress accuracy matters. TET4 (linear tetrahedral) elements are too stiff in bending, a consequence of their constant strain field formulation, and significantly under-predict deflections and peak stresses at stress concentrations. For a curved fillet where the peak stress is the analysis objective, TET4 elements can under-predict the peak by 30 to 50 percent compared to the converged result, even with a very fine mesh. TET10 elements require approximately 3 to 5 times more computation per element but produce dramatically better stress predictions at the same mesh density. The only legitimate use of TET4 is as a rapid approximation for checking geometry or connectivity, never for final stress results.
Q: How do I check if my model has rigid-body motion?
Run a free-vibration modal analysis requesting the first 10 to 12 modes before submitting the static analysis. In a correctly constrained 3D model, all modal frequencies are above zero (typically the first mode is above 10 Hz for a stiff structure and above 1 Hz for a flexible one). Any mode with a frequency essentially equal to zero (the solver may report it as 0.001 Hz or 0.0 Hz depending on numerical precision) is a rigid-body mode, evidence of an unconstrained degree of freedom.
Identify which mode shape corresponds to the near-zero frequency: translation in X, Y, or Z, or rotation about X, Y, or Z. That identifies which constraint is missing. Add the constraint, re-run the modal check, and repeat until all near-zero modes disappear.
Q: What is the difference between bonded contact and merged nodes at an interface?
Merged nodes (or equivalencing, as it is called in Nastran and Abaqus) creates a single set of nodes shared by both parts at the interface, the parts are topologically connected and there is no contact computation. This is the most computationally efficient way to model a bonded interface with no relative slip possibility. Bonded contact defines a contact pair between two surfaces, with a constraint that prevents separation and relative sliding, it is slightly more expensive computationally but does not require mesh compatibility (the two surface meshes can have different node patterns).
For bonded interfaces where no separation or sliding is possible under any load case, merged nodes are preferred for efficiency. Use bonded contact when: the meshes on the two sides are incompatible (different element sizes or patterns), when you need to extract interface stresses or separation forces, or when the bonding may be conditional (bonded in compression, open in tension), in which case a more sophisticated contact formulation is needed.
Q: How long should FEA preprocessing take?
Preprocessing time scales with model complexity and the analyst’s experience and tool proficiency, but a useful benchmark is that preprocessing (geometry cleanup, meshing, BC setup, load application, and pre-solve verification) should take 3 to 5 times longer than the solver run for a well-organized analysis. If preprocessing takes less than the solver run, the setup is probably too rushed and systematic checks are being skipped.
If preprocessing takes more than 10 times the solver run, either the geometry is excessively complex and needs simplification, or the analyst’s geometry cleanup workflow needs efficiency improvement. For a linear static analysis that solves in 2 hours, 6 to 10 hours of preprocessing is typical for a moderately complex assembly. For a 24-hour crash simulation, 3 to 7 days of preprocessing is normal, crash simulation preprocessing is among the most time-intensive in industrial FEA.
Conclusion:
FEA preprocessing is the phase of the analysis where engineering judgment is most heavily exercised and where errors are most consequential. The solver is largely deterministic, given a correct model, it will return a correct result. But the model correctness depends entirely on the hundreds of decisions made during preprocessing: which features to simplify, what element type to use, whether the material coordinate system is aligned with the fiber direction, whether the boundary condition constrains the right degrees of freedom, whether the load is applied in the correct direction. Each decision is an opportunity for error, and the solver cannot distinguish between a correct model and a plausible-looking incorrect one.
The 30-point checklist in this article is a systematic defense against preprocessing error, not because it catches every possible mistake, but because it forces the analyst to explicitly verify each category of decision rather than assuming it is correct because it was set up without obvious problems. The checklist items labeled Critical are the ones where a single error produces results that are wrong by a factor of 2 or more. The items labeled High produce errors of 10 to 50 percent. Together, they cover the preprocessing decisions responsible for the large majority of wrong FEA results in industrial practice.
Use this checklist before every analysis run. Use it during peer review of other analysts’ models. Build it into the analysis quality plan for any project where the FEA results will be used to make a design decision, support a regulatory submission, or verify structural integrity. The minutes spent checking are the insurance policy against the hours spent rerunning, and against the much greater cost of a field failure that a correct analysis would have predicted.
Extend your FEA knowledge with our guides on boundary condition selection, static vs dynamic analysis, stress concentration analysis, mesh quality and convergence, and common FEA errors that produce wrong results despite correct solver execution.
Leave a Reply