The Boeing 777 was the first commercial aircraft designed entirely on computers, no physical mockup was built before the first flight. The development team ran over 600 wind tunnel simulations digitally before any physical tunnel time was used for final validation. The aircraft entered service within budget, with no major design changes required after first flight. For comparison, the 767 program that preceded it required extensive physical mockup work and multiple design iterations discovered only through hardware testing. The shift was not in the engineers’ skill, it was in the workflow. Simulation had become the primary design tool, and physical testing had become the validation step for a design already understood through analysis.
That shift, from test to validate an unknown design to simulate to understand, then test to confirm, is what simulation-driven design means in practice. It is not a replacement for physical testing. It is a restructuring of the development process so that problems are found and solved in software, where iterations cost hours and dollars, rather than in hardware, where iterations cost weeks and millions. The industries that have made this shift most completely are the ones where the combination of competitive pressure, safety requirements, and engineering complexity has made the old prototype-heavy workflow untenable.
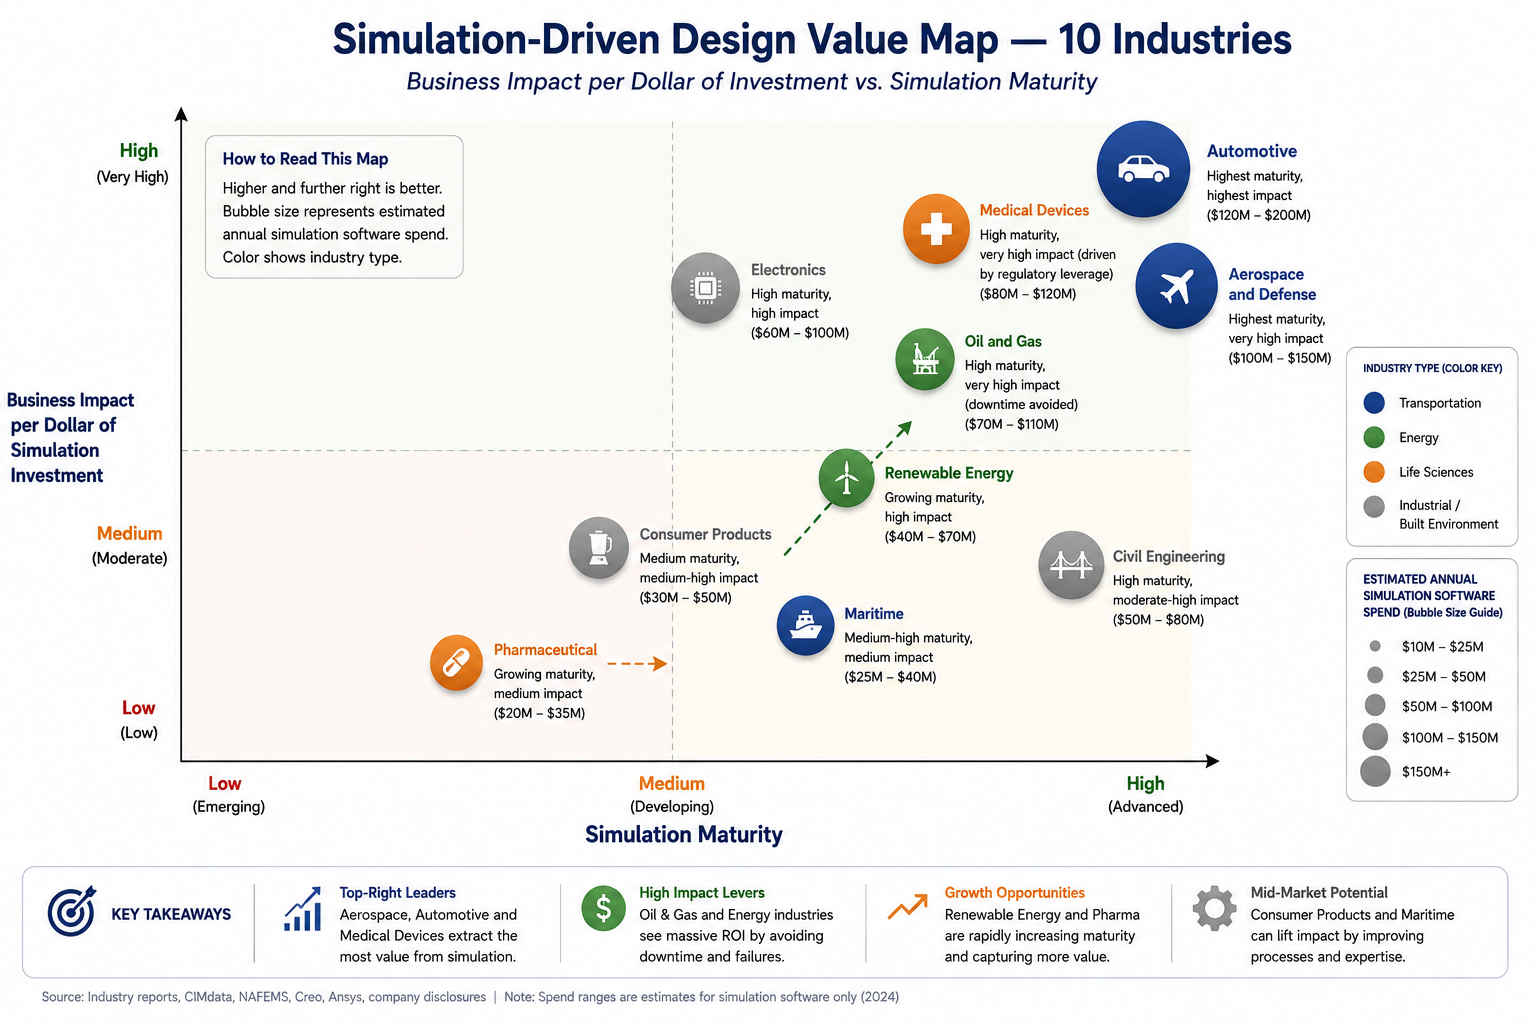
This article examines the ten industries where simulation-driven design has delivered the greatest measurable impact: the specific simulation types each industry uses, the business problems that drove adoption, the ROI metrics that justify simulation investment, and the particular use cases that illustrate how simulation changes outcomes. It also covers the eight value levers through which simulation delivers returns across all industries, because while the applications differ, the economic logic of replacing expensive physical iteration with cheap digital iteration is universal.
The Economic Logic of Simulation-Driven Design
The business case for simulation-driven design rests on a single asymmetry: the cost of finding a design problem grows by roughly an order of magnitude at each successive stage of product development. A stress concentration discovered in the CAD model costs an engineer a few hours to redesign. The same problem discovered in a physical prototype costs the prototype build cost plus the test cost plus the redesign cycle, typically 10 to 50 times more. Discovered in field service after product launch, the same problem costs warranty claims, potential recall, liability exposure, and brand damage, 100 to 10,000 times more than the CAD-stage fix.
Simulation-driven design moves problem discovery as early as possible in the development process, before physical hardware exists. Every iteration that simulation handles, every design variant evaluated, every load case checked, every failure mode explored, is an iteration that does not require a physical build-and-test cycle. The return on simulation investment is fundamentally a function of how many physical iterations it displaces and how far into the development process those iterations would have occurred without simulation.
The Eight Value Levers: How Simulation Delivers Returns
Across all ten industries covered in this article, simulation delivers business value through eight distinct levers. Understanding which levers are most important in a given industry explains why simulation adoption has proceeded at different rates and produced different returns in different sectors.
| Value Lever | What Simulation Replaces or Reduces | Typical Saving | Industries Where This Dominates |
| Physical prototype reduction | Physical builds, tooling, materials, lab technician time | Fewer physical prototypes and reduced development costs in organizations with mature simulation practices.1 | Automotive, consumer products, medical devices, electronics |
| Physical test reduction | Crash tests, fatigue rigs, pressure tests, thermal chambers, wind tunnels | Reduced reliance on physical testing by shifting design validation earlier into virtual simulation. | Aerospace, automotive, medical, renewable energy |
| Development cycle compression | Sequential build-test-fix loops replaced by parallel simulation iteration | Shorter development cycles through earlier design validation and faster engineering iteration.¹ | Automotive, consumer electronics, medical devices |
| Material and weight optimization | Over-designed components due to uncertainty; excess material from conservative assumptions | Improved structural optimization and more efficient material utilization. | Aerospace (fuel burn), automotive (EV range), civil (steel usage) |
| Warranty and field failure reduction | Root cause investigation, recall costs, brand damage from field failures | Lower risk of field failures through earlier identification of design issues. | Automotive, consumer products, medical devices |
| Regulatory submission support | Additional physical testing required by regulators; repeated submissions due to test failures | Faster approval timelines; simulation evidence accepted in lieu of some physical tests | Medical devices (FDA), aerospace (FAA/EASA), nuclear (NRC) |
| Process and yield optimization | Pilot plant trials, batch failures, scale-up surprises in chemical and pharmaceutical processes | Significant reduction in pilot plant duration and cost; improved first-pass yield | Pharmaceutical, chemical processing, food and beverage |
| Asset life extension | Conservative decommissioning of structures with remaining life; unplanned maintenance | Change to Extended service life through validated fitness-for-service assessments. | Oil and gas, civil infrastructure, power generation |
Industry Summary: Simulation Types, Drivers, and Maturity
The following table summarizes how simulation-driven design manifests across the ten industries covered in this article, including the primary simulation types used, the key business driver that motivates investment, and the maturity level of simulation adoption in each sector.
| Industry | Primary Simulation Types | Key Business Driver | Typical ROI Metric | Maturity Level |
| Aerospace & Defense | Structural FEA, CFD, thermal, fatigue, crash/impact, aeroelasticity | Safety certification, weight reduction, fuel efficiency | Reduced physical prototype iterations and improved certification efficiency through simulation-supported design validation. | Highest, simulation is mandatory for certification (FAA, EASA) |
| Automotive & Mobility | Crash simulation, NVH, CFD aerodynamics, powertrain thermal, fatigue | Safety ratings, emissions targets, EV range optimization | Significant reduction in physical crash prototypes through extensive virtual crash simulation during development. | Highest, OEMs run millions of simulation hours per vehicle program |
| Medical Devices | Structural implant analysis, CFD blood flow, fatigue, biomechanics | FDA/CE regulatory submission, implant safety, surgical planning | Faster 510(k) and PMA submissions; reduced cadaver and animal testing costs | High, FDA increasingly accepts simulation evidence in submissions |
| Oil & Gas / Energy | Pressure vessel FEA, pipeline fatigue, CFD flow assurance, thermal stress | Asset integrity, failure prevention, regulatory compliance (ASME, API) | Avoided unplanned downtime ($1M+/day for offshore platforms) | High, simulation embedded in fitness-for-service and life extension assessments |
| Civil & Structural Engineering | Linear and nonlinear FEA, seismic analysis, wind CFD, fatigue | Code compliance (Eurocode, ASCE), life safety, material optimization | Improved material efficiency through simulation-driven structural optimization. | High, seismic and wind simulation required by codes for complex structures |
| Electronics & Semiconductors | Thermal FEA, PCB structural, random vibration, electromagnetic | Junction temperature limits, solder joint fatigue, EMI compliance | Elimination of multiple board spins; thermal design validated before first prototype | High, thermal simulation standard in IC package and PCB design |
| Consumer Products | Drop test simulation, ergonomic stress analysis, injection mold flow | Product durability, cost reduction, time to market | Reduced prototype builds through virtual drop testing and structural optimization. | Medium-High, adopted by leading brands; smaller companies still prototype-heavy |
| Renewable Energy | Blade structural FEA, fatigue (IEC 61400), CFD wind flow, thermal PV | 20-year fatigue life certification, LCOE reduction, grid reliability | Turbine blade cost optimization; foundation cost reduction for offshore wind | High and growing, simulation central to IEC certification for wind turbines |
| Maritime & Offshore | Hull structural FEA, hydrodynamic CFD, fatigue, sloshing, corrosion | Classification society rules (DNV, Lloyd’s), FPSO integrity, wave loads | Reduced physical model basin tests; optimized hull form for fuel efficiency | Medium-High, class societies increasingly accept simulation for novel designs |
| Pharmaceutical & Chemical | Reactor CFD (mixing, heat transfer), pressure vessel FEA, piping stress | Process safety, reaction yield optimization, equipment integrity | Reduced pilot plant testing; process scale-up de-risked by CFD | Medium, CFD for mixing and reactor design growing; structural well established |
1. Aerospace and Defense: Where Simulation Is Mandatory
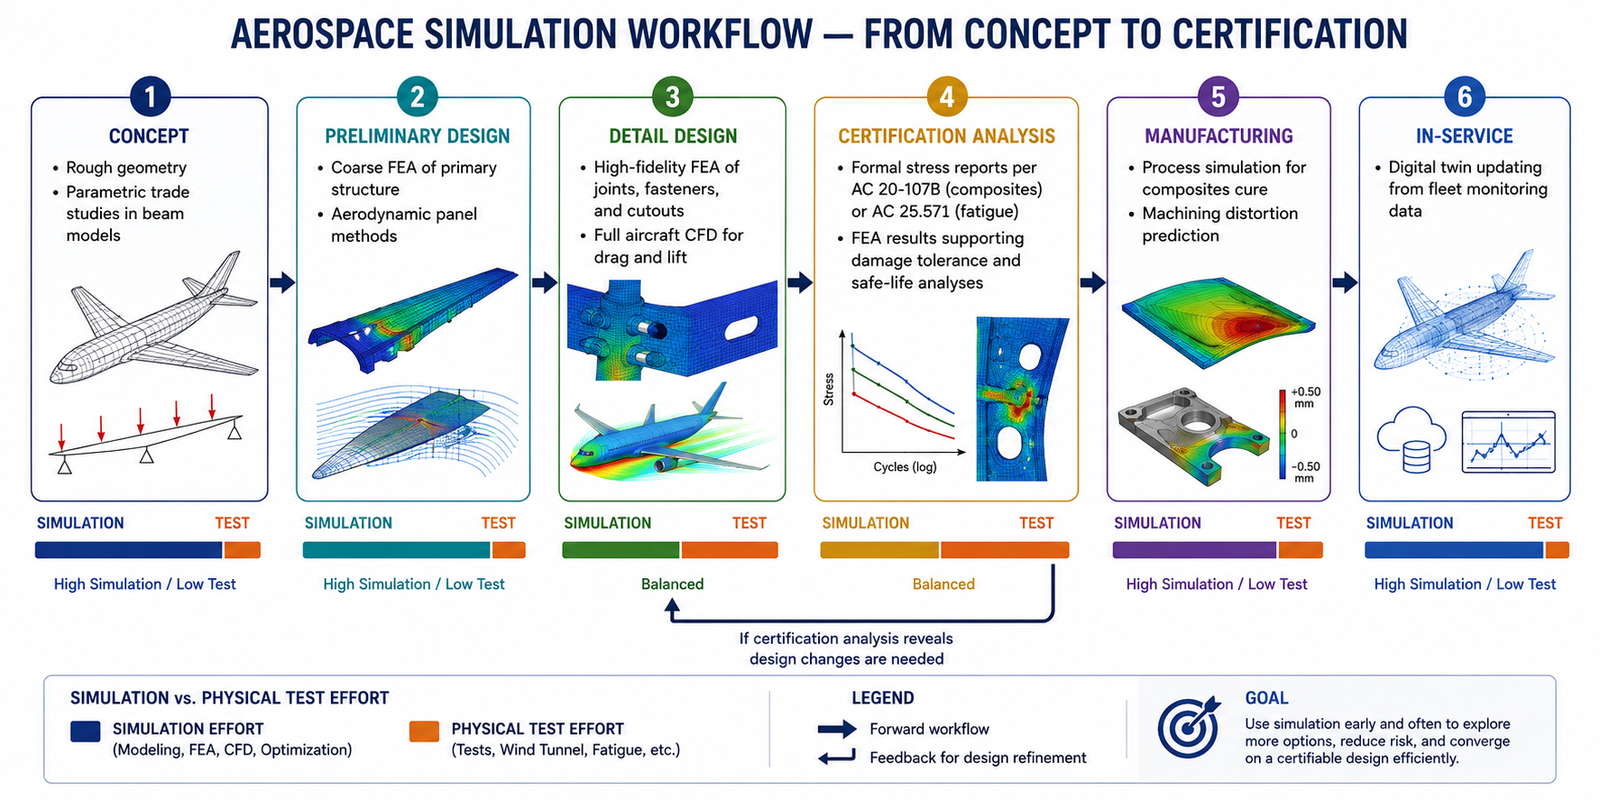
Aerospace and defense is where simulation-driven design is most deeply embedded, most rigorously validated, and most tightly integrated with regulatory requirements. The FAA and EASA do not simply accept simulation results as supporting evidence, in many cases, simulation is the required method. AC 20-107B (composite aircraft structure) and AC 25.571 (damage tolerance and fatigue) define the analytical methods that must be applied to demonstrate airworthiness, and FEA is central to both. An aircraft that cannot be certified through analysis cannot enter service, regardless of how well it performs in flight test.
The primary simulation types in aerospace are structural FEA for primary and secondary structure, computational fluid dynamics for aerodynamic performance and thermal management, aeroelastic analysis (coupling structural FEA with aerodynamic loads to predict flutter, divergence, and control surface effectiveness), fatigue and damage tolerance analysis, and impact simulation for bird strike and engine containment requirements. For space applications, thermal analysis under vacuum cycling, acoustic vibration during launch, and hypervelocity impact simulation for orbital debris are added to this list.
Weight Reduction: The Dominant Value Driver
In aerospace, every kilogram of structural weight saved translates directly into either payload capacity or fuel burn reduction. The rule of thumb for commercial aircraft is that 1 kg of structural weight saving is worth approximately $1,000 to $3,000 in lifetime fuel cost per aircraft, depending on fuel price and aircraft utilization. For a fleet of 500 aircraft, a 100 kg structural optimization, entirely achievable through simulation-driven topology optimization and refined stress analysis, represents $50 million to $150 million in fleet-level fuel savings over the aircraft’s service life.
Simulation enables weight reduction by allowing engineers to reduce the uncertainty margin in structural sizing. Traditional design relied on conservative empirical safety factors because the actual stress distribution in complex joints, cutouts, and composite laminates could not be precisely calculated by hand. FEA resolves the actual stress field with sufficient accuracy that the structural sizing can be driven to the actual load limit rather than a conservative bound. The weight saved is the material that was previously added to cover analytical uncertainty, material that simulation reveals to be unnecessary.
Composite Structure: Where Simulation Is Irreplaceable
Modern aircraft primary structure is predominantly carbon fiber reinforced polymer (CFRP) composite. The mechanical behavior of composites, ply-by-ply stress distribution, interlaminar shear, delamination initiation, and progressive failure under combined loading, cannot be predicted by closed-form analysis for any realistic geometry. FEA with progressive damage models is the only viable analytical method for composite certification analysis. The development of the Boeing 787, Airbus A350, and their successors required extensive composite simulation capability that did not exist in the 1990s. The weight savings that make these aircraft economically viable, 20 percent fuel burn improvement over equivalent aluminum aircraft, are only achievable because composite structure can be accurately analyzed through simulation.
2. Automotive: The Highest Simulation Volume Industry
The automotive industry runs more simulation hours per product program than any other industry on earth. A new vehicle platform at a major OEM involves hundreds of thousands of individual FEA and CFD analyses spread across crash safety, noise-vibration-harshness (NVH), aerodynamics, powertrain thermal management, fatigue durability, manufacturing process simulation, and pedestrian safety. The simulation infrastructure at a major OEM, software licenses, high-performance computing clusters, validation databases, simulation process automation, represents an investment of hundreds of millions of dollars. This is not optional: it is the only way to develop a vehicle in 24 to 36 months that meets the safety, emissions, and performance requirements of global markets.
Crash Simulation: The Most Consequential Application
The most visible and most consequential simulation application in automotive is crash analysis. A full frontal crash simulation, one vehicle impacting a rigid barrier at 56 km/h, as required by NCAP and FMVSS 208, involves an explicit dynamics FEA model with 5 to 15 million elements, a time duration of 100 to 150 milliseconds, and a time step in the microsecond range.
The analysis captures the complete crushing sequence of the front end energy absorbers, the intrusion into the occupant cell, the airbag deployment timing, and the forces transmitted to the occupant through the seat belt and airbag system. A single crash simulation run takes 8 to 24 hours on a dedicated HPC cluster with 64 to 256 CPU cores.
Without crash simulation, the only way to evaluate a structural design change is to build a physical prototype and test it, a process that costs $150,000 to $500,000 per test for the prototype build and test facility time, and takes 8 to 16 weeks for the build-to-test cycle. A crash simulation run costs a few hundred dollars in compute time and returns results in less than a day. A major OEM runs 50 to 200 crash simulations per week during peak development, exploring design variants and load cases that would be financially and temporally impossible to evaluate through physical testing alone.
NVH: The Quality Differentiator
Noise, vibration, and harshness (NVH) performance is one of the primary differentiators of vehicle quality perception. The low-frequency boom of a diesel engine at idle, the wind noise at highway speed, the impact harshness over road irregularities, the tonal quality of the door close sound, all of these are engineering outcomes that can be predicted and optimized through simulation before any physical vehicle exists. NVH simulation uses modal analysis to predict structural resonances, harmonic response to evaluate excitation from powertrain and road inputs, and acoustic FEA or boundary element methods to predict interior sound pressure levels.
The EV transition has made NVH simulation even more critical. Internal combustion engines mask high-frequency structural and wind noise through their own broadband noise floor. Electric powertrains are nearly silent, making previously inaudible structural resonances, gear whine, inverter switching noise, bearing tone, suddenly perceptible to occupants. OEMs developing EV platforms have had to rebuild their NVH simulation models from scratch to capture frequency ranges (2,000 to 8,000 Hz) that were irrelevant in ICE vehicles, investing heavily in high-frequency FEA and acoustic simulation capability that did not exist in their ICE-era toolchains.
3. Medical Devices: Simulation as Regulatory Evidence
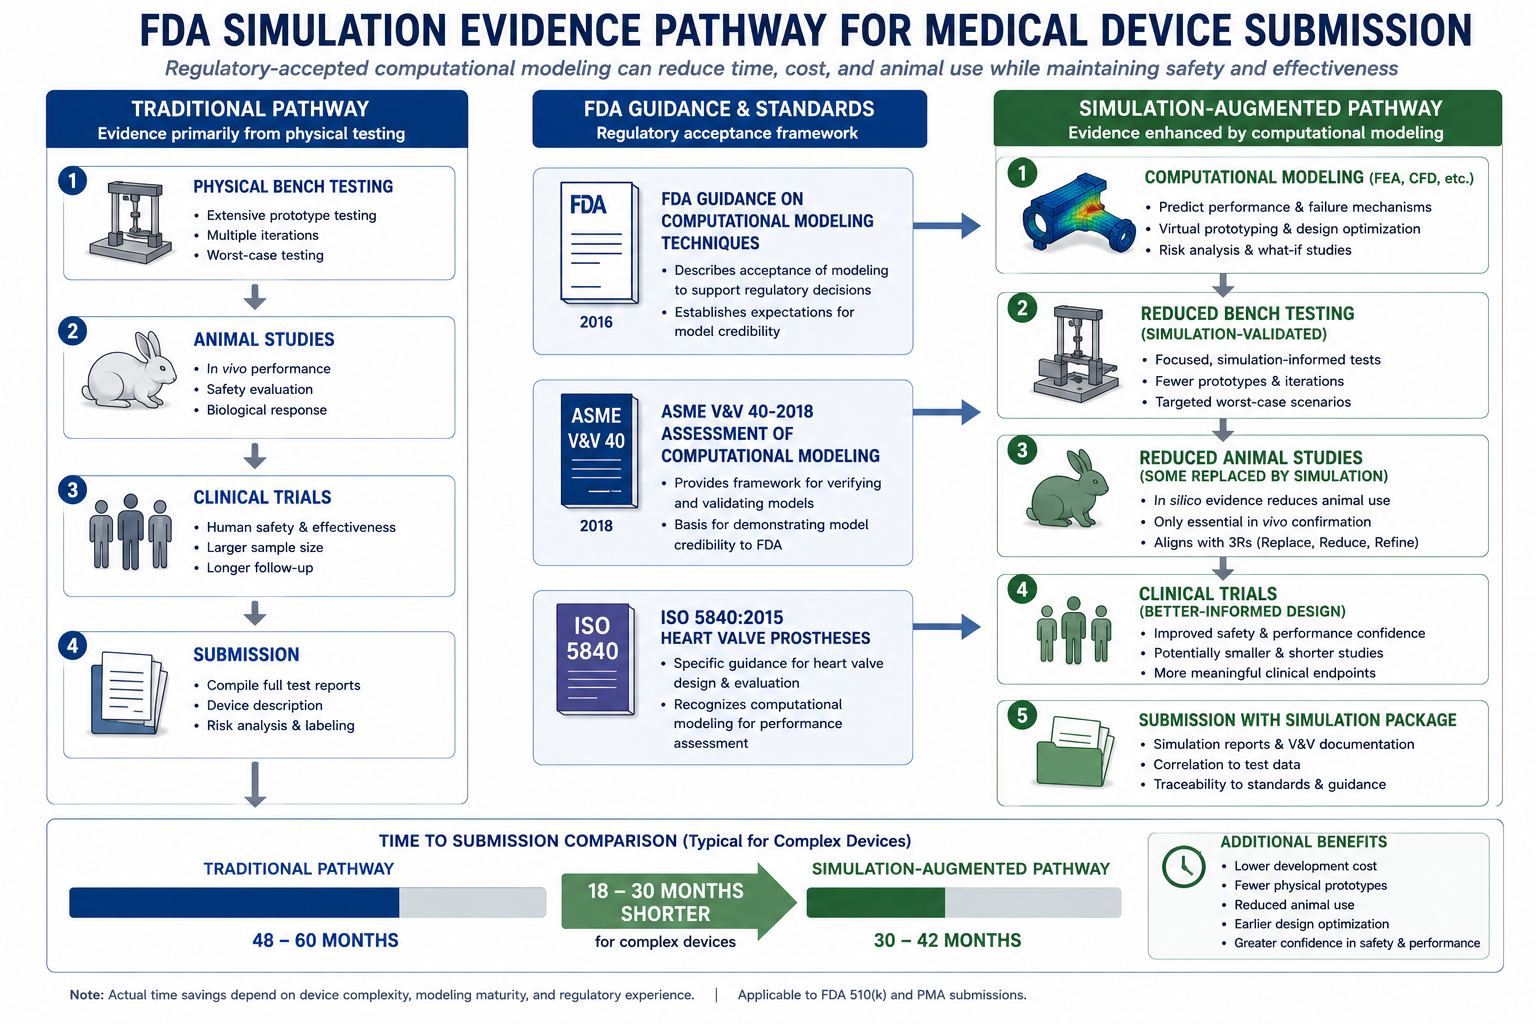
The medical device industry has a unique relationship with simulation: in addition to its engineering value in reducing prototypes and improving design, simulation output can be submitted directly to the FDA as evidence supporting device clearance or approval. The FDA’s guidance on computational modeling and simulation (issued 2016, updated 2019) and the ASME V&V 40 standard for medical device simulation credibility together define a framework under which simulation results, if generated with demonstrated credibility, can substitute for some physical bench tests in a regulatory submission. This transforms simulation from an engineering cost center into a regulatory strategy tool.
The medical device applications of simulation span implant structural analysis (hip and knee prostheses under walking, stair-climbing, and fall loading scenarios per ISO 14242 and ISO 14243), cardiovascular device fluid dynamics (heart valve opening and closing, stent deployment and hemodynamics, left ventricular assist device flow fields), spinal implant fatigue analysis, orthopedic screw pull-out prediction, and catheter and guidewire flexibility simulation for interventional devices.
Orthopedic Implants: Fatigue Life Prediction Under Physiological Loading
Hip and knee replacement implants must survive at least 10 million loading cycles, representing approximately 10 years of patient activity, without fatigue fracture. Physical fatigue testing to 10 million cycles at physiological load rates takes months of continuous testing on specialized rigs. Simulation allows the engineer to evaluate multiple implant geometries and surface finish variants in parallel, identify the fatigue-critical location from the maximum principal stress amplitude, and select the geometry that minimizes stress concentration at the critical location before any physical testing begins.
The FDA’s acceptance of simulation evidence for orthopedic implants is well-established: finite element analysis of implant stress under the loads defined in ISO 14242 (hip) and ISO 14243 (knee) is a standard component of 510(k) and PMA submissions for total joint replacement devices. Simulation does not eliminate the physical fatigue test, it focuses the physical test on the design that simulation has already shown to be the best candidate, reducing the number of physical test iterations from four to six to one or two.
Cardiovascular CFD: Blood Flow, Hemolysis, and Thrombosis Risk
Computational fluid dynamics in cardiovascular devices addresses questions that physical testing cannot answer directly: the shear stress on blood cells as they pass through a heart valve orifice (governing hemolysis risk), the residence time of blood in regions of flow stagnation (governing thrombosis risk), and the pressure drop across a device (governing the hemodynamic burden on the patient’s heart). These are fluid dynamics quantities that require CFD to compute, no physical test can directly measure shear stress on individual red blood cells in a flowing field.
The FDA’s guidance on heart valve simulation (referencing ISO 5840) explicitly describes the use of CFD for flow field characterization and the acceptable validation methodology. For transcatheter heart valves, one of the most rapidly growing device categories, CFD simulation of the deployed valve geometry is standard practice in the development workflow at every major cardiovascular device company. The simulation informs leaflet geometry optimization, frame design, and deployment configuration, reducing the number of in-vitro and animal study iterations required before first-in-human trials.
4. Oil and Gas: Simulation for Asset Integrity and Life Extension
The oil and gas industry’s motivation for simulation is different from consumer-facing industries: it is not primarily about reducing time to market or cutting prototype costs. It is about preventing catastrophic failures in equipment that operates under extreme conditions, high pressure, high temperature, corrosive fluids, cyclic loading from waves and currents, and remoteness that makes inspection and maintenance expensive. An unplanned shutdown of an offshore production platform costs $1 million or more per day in lost production and intervention costs.
A structural failure of a subsea pipeline or riser can cost billions in response, cleanup, and liability. The ROI calculation for simulation in this industry is asymmetric: the simulation investment is measured in thousands to hundreds of thousands of dollars; the failure it prevents is measured in millions to billions.
The primary simulation applications are pressure vessel and piping stress analysis per ASME Section VIII and B31.3, fatigue analysis of offshore risers and mooring systems under wave and current loading per API RP 2A and DNV standards, CFD for flow assurance (multiphase flow behavior in pipelines, slug flow prediction, hydrate formation risk), thermal stress analysis of high-temperature process equipment, and fitness-for-service assessment of aging equipment with detected flaws per API 579 / BS 7910.
Fitness-for-Service: Simulation Extending Asset Life
One of the highest-value simulation applications in oil and gas is fitness-for-service (FFS) assessment of equipment with detected damage, corrosion, erosion, fatigue cracks, dents, and gouges found during inspection. Without simulation, the conservative approach is to decommission or replace any equipment where the remaining wall thickness falls below a code minimum or where a flaw exceeds a simplified acceptance criterion. With FFS simulation using fracture mechanics FEA, the analyst can demonstrate that a specific flaw in a specific location under the actual loading conditions will not propagate to failure within a defined inspection interval, allowing continued operation of equipment that a simplified code check would have condemned.
API 579 / ASME FFS-1 defines three levels of FFS assessment: Level 1 (simplified charts and tables), Level 2 (more detailed calculation methods), and Level 3 (advanced analysis including FEA). Level 3 FFS assessments using fracture mechanics FEA routinely extend the service life of offshore platforms, subsea pipelines, and process vessels by five to fifteen years beyond what simplified assessment would permit, representing asset value of hundreds of millions of dollars per major installation
Subsea Riser Fatigue: The Long-Duration Dynamic Analysis Challenge
Subsea risers, the pipes connecting seabed wellheads to floating production vessels, experience continuous fatigue loading from wave-induced vessel motion, vortex-induced vibration (VIV) from ocean currents, and installation loads. The cumulative fatigue damage over a 20-year field life must be predicted during the design phase to ensure that inspection intervals are set correctly and that fatigue life targets are met. This requires dynamic analysis of the riser system over thousands of sea states, each represented by a wave height and period with associated probability of occurrence, integrated over the full 20-year period to produce cumulative fatigue damage predictions at every weld location on the riser
The simulation workflow for riser fatigue involves hydrodynamic load calculation using Morison’s equation or full 3D CFD, structural dynamic analysis of the riser string under those loads, stress concentration factor extraction at critical weld locations, S-N fatigue life prediction per DNV RP C203, and probabilistic combination of results across all sea states. Without simulation, this calculation is impossible, no physical test can replicate 20 years of ocean exposure in a controlled laboratory environment. Simulation is the only design tool available for this application.
5. Civil and Structural Engineering: Code Compliance and Optimization
Civil and structural engineering was an early adopter of FEA, the method was developed in part for structural analysis of aircraft and bridges in the 1950s and 1960s. But the industry’s relationship with simulation is different from manufacturing industries: in civil engineering, the structure is typically unique (each bridge, building, or dam is a one-off), the design life is measured in decades to centuries, and the regulatory framework (building codes, bridge standards, dam safety regulations) defines explicit analytical requirements that simulation must satisfy.
The business case is less about prototype reduction (there are no prototypes in civil engineering) and more about material optimization, code compliance demonstration for novel structures, and seismic or wind performance prediction for structures where simplified code methods are insufficient.
Seismic Analysis: Where Dynamic Simulation Is Code-Required
For structures in seismic zones, building codes (ASCE 7 in the United States, Eurocode 8 in Europe, IS 1893 in India) require dynamic analysis for irregular structures, tall buildings, and critical facilities. Response spectrum analysis and nonlinear time history analysis are mandated analytical methods, not optional enhancements. An irregular 40-story building in a high-seismic zone in San Francisco cannot be designed using the simplified equivalent lateral force method that the code allows for regular, low-rise structures. The response spectrum or nonlinear time history analysis is not just an engineering tool, it is a regulatory requirement.
Performance-based earthquake engineering (PBEE), the methodology behind modern seismic design codes, uses nonlinear FEA to predict structural behavior not just at code-level design earthquakes but across the full range of ground motion intensities, from serviceability-level events to maximum credible earthquakes. This requires nonlinear material models for concrete crushing and steel yielding, large-deformation geometry, and structural collapse prediction through incremental dynamic analysis. No simplified hand calculation method can perform this analysis, FEA is the only viable tool.
Wind Engineering: CFD for Tall Buildings and Long-Span Bridges
Wind loads on tall buildings and long-span bridges cannot be accurately predicted by the pressure coefficients in building codes for structures above approximately 200 meters in height or bridges with spans above approximately 500 meters. For these structures, computational wind engineering, CFD simulation of the wind flow field around the structure, is the accepted alternative to physical wind tunnel testing, and is often used in combination with wind tunnel studies to validate and extend the CFD results.
The most dramatic historical example of wind engineering failure is the Tacoma Narrows Bridge collapse of 1940, which failed in aeroelastic flutter at a wind speed far below its design wind load. Modern bridge design uses coupled CFD and structural FEA, exactly the aeroelastic analysis that was not available in 1940, to predict flutter onset speed, vortex-induced vibration response, and buffeting loads from turbulent wind. Every major long-span bridge designed since the 1970s has used wind engineering simulation as a core design tool, driven directly by the lessons of Tacoma Narrows.
6. Electronics and Semiconductors: Thermal Simulation as a Survival Tool
In electronics, simulation is not a competitive differentiator, it is a survival requirement. The thermal limits of semiconductor devices are absolute: junction temperatures above the rated maximum (typically 125°C to 175°C for silicon) degrade performance, accelerate electromigration, and ultimately cause permanent failure. A device that overheats fails. A PCB layout that creates hotspots produces unreliable products. The thermal design of any electronic system, from a smartphone processor to a power inverter to a satellite transmitter, must be resolved before first silicon or first board spin, because the cost of discovering a thermal problem in hardware is an entirely new design and fabrication cycle.
The primary simulation types in electronics are thermal FEA for package and PCB-level thermal resistance calculation, computational fluid dynamics for heat sink and system-level airflow optimization, structural FEA for PCB mechanical stress under mounting and connector loads, random vibration analysis for PCB solder joint fatigue life prediction under transportation and operating vibration environments, and electromagnetic simulation for EMI/EMC compliance prediction.
Power Electronics: Thermal Cycling Fatigue of Solder Joints
Power electronic modules, IGBTs, MOSFETs, diodes in inverters and converters, experience large thermal cycles as the power load varies. Each thermal cycle stresses the solder joints and die attach layers between the semiconductor die and the substrate, accumulating fatigue damage. Solder joint fatigue is the primary failure mechanism in power electronics, and the number of thermal cycles to failure depends on the temperature range, the mean temperature, the dwell time at peak temperature, and the coefficient of thermal expansion mismatch between the die, solder, and substrate materials.
Simulation of thermal cycling fatigue in power modules uses coupled thermal-structural FEA: the thermal analysis predicts the temperature distribution as a function of power dissipation and cooling conditions, and the structural analysis computes the resulting thermal stresses and plastic strains in the solder layer. Coffin-Manson fatigue models applied to the simulated plastic strain range predict cycles to failure. This simulation workflow is the standard reliability prediction method for power module qualification across the automotive, industrial, and renewable energy power electronics industries, replacing or reducing the extensive physical thermal cycling tests previously required.
7. Consumer Products: Drop Test Simulation and Time-to-Market
Consumer product development operates under a time and cost pressure that manufacturing industries do not face in the same form: product cycles are measured in months, not years, and the cost of delaying a product launch by even one quarter can exceed the entire simulation investment many times over. A smartphone OEM that misses the holiday launch window loses not just the delayed revenue but the market positioning advantage. In this environment, any tool that compresses the design-validate-launch cycle has immediate and quantifiable business value.
The primary simulation applications in consumer products are drop test simulation (predicting failure of screens, housings, internal components under the free drops specified by MIL-STD-810 or product-specific internal standards), injection mold flow simulation (predicting fill pattern, weld lines, warpage, and cooling time before tooling is cut), structural FEA for hinge and latch mechanisms under repeated operation loading, vibration fatigue for portable devices used in high-vibration environments, and ergonomic stress analysis for handles and grips.
Smartphone Drop Test Simulation: The iPhone Effect
The smartphone industry has driven the development of drop test simulation capability more than any other consumer product sector. A modern smartphone must survive drops onto concrete from a height of 1.5 to 1.8 meters in multiple orientations, corner drop, edge drop, flat drop, without screen fracture or functional failure. The glass ceramic screen materials (Corning Gorilla Glass, Schott Xensation) have complex fracture behavior that must be captured by explicit dynamics FEA with cohesive zone fracture models or element deletion at the failure stress.
Each smartphone generation involves hundreds of drop simulation runs across all drop orientations, all housing material variants, and all protective case configurations. Physical drop testing at the scale that simulation enables would require $20 million to $50 million per product generation in prototype builds and test facility time, an investment that is simply not feasible on a one-year product cycle. Simulation compresses this to a fraction of the cost and a fraction of the time, allowing design optimization of housing geometry, internal support structure, and glass attachment method before any physical prototypes are built.
8. Renewable Energy: Simulation for 20-Year Fatigue Life Certification
The renewable energy industry, wind turbines, solar installations, and energy storage systems, faces a unique simulation challenge: components must be designed for 20 to 30 years of fatigue life under variable, stochastic loading, and the certification standards that govern this design (IEC 61400 for wind turbines, IEC 61215 for PV modules) require specific simulation methods to demonstrate fatigue life compliance. Like aerospace, simulation in renewable energy is not just an engineering tool, it is a certification requirement.
Wind Turbine Blade Structural Analysis
A wind turbine blade is one of the most mechanically demanding structural components in any industry: it must be simultaneously stiff enough to avoid striking the tower under maximum load, flexible enough to shed extreme wind loads through aeroelastic deflection, light enough to minimize fatigue loads at the hub, and strong enough to survive 20 years of fatigue loading from billions of load cycles at varying wind speeds and directions. The blade structural design uses coupled aeroelastic-structural simulation, the aerodynamic load model and the structural FEA are iterated together because the blade deflection changes the aerodynamic load distribution, which changes the deflection, which changes the load
IEC 61400-1 defines the design load cases, the combinations of wind speed, turbulence, direction changes, grid faults, and emergency stops, that a wind turbine must be analyzed against. There are more than 50 design load cases in the standard, each requiring a time-domain aeroelastic simulation typically 600 seconds in duration. For a turbine with a 20-year design life, the simulation covers a statistically representative sample of all operating conditions the turbine will experience, and the resulting fatigue loads are integrated to produce cumulative damage at every structural joint and bonded connection in the blade, hub, tower, and foundation.
Offshore Wind: Foundation Optimization
Offshore wind turbine foundations, monopiles, jacket structures, and floating platforms, are a major cost driver for offshore wind energy, representing 20 to 35 percent of installed project cost for fixed-bottom installations. Foundation geometry optimization through structural FEA and geotechnical simulation can reduce foundation steel weight by 10 to 20 percent, translating directly to levelized cost of energy (LCOE) reduction. For a 1 GW offshore wind project with 100 turbines, a 15 percent foundation steel reduction is worth $30 million to $50 million in material and installation cost savings, a clear return on even a substantial simulation investment.
9. Maritime and Offshore: Classification Society Acceptance of Simulation
The maritime industry’s adoption of simulation-driven design has been shaped by its regulatory framework: ships and offshore structures must be certified by classification societies (DNV, Lloyd’s Register, Bureau Veritas, ABS) whose rules define the acceptable design methods. Historically, class rules were based on simplified prescriptive formulas derived from empirical data. Over the past two decades, all major classification societies have developed direct calculation guidelines that permit, and in some cases require, FEA and CFD as alternatives to their prescriptive rule formulas for novel designs, large vessels, and complex structural details.
The primary simulation applications are hull structural FEA for global and local strength under sea loads (wave bending moments, sloshing in tanks, slamming on the bow and bottom), hydrodynamic CFD for resistance and propulsion efficiency (hull form optimization for fuel consumption), fatigue analysis of structural details (brackets, web frames, hatch corners) under wave-induced cyclic loads, mooring system dynamics for offshore floating structures, and noise and vibration analysis for passenger vessels and naval ships.
Hull Form Optimization: CFD for Fuel Efficiency
Ship fuel consumption is the largest operating cost for most commercial vessels, representing 40 to 60 percent of total operating cost. A 5 percent improvement in hull resistance, achievable through CFD-optimized hull form design, translates directly to a 5 percent reduction in fuel consumption. For a large container ship consuming 150 tonnes of fuel per day at $600 per tonne, a 5 percent saving is $4,500 per day or $1.6 million per year per vessel.
CFD hull form optimization replaces or supplements physical towing tank testing, which costs $50,000 to $200,000 per hull variant tested. A CFD optimization study can evaluate 50 to 200 hull variants in the time and cost that a physical towing tank program could evaluate 5 to 10. The hull form that emerges from a CFD optimization program is consistently better than what physical testing alone would find, because the much larger design space explored by CFD identifies optimum forms that physical testing’s narrower sampling would miss.
10. Pharmaceutical and Chemical Processing: CFD for Scale-Up and Safety
The pharmaceutical and chemical processing industries have been slower to adopt simulation-driven design than manufacturing industries, but adoption is accelerating as the complexity and regulatory scrutiny of process equipment increases. The primary driver is process scale-up risk: a batch process that works perfectly in a 50-liter laboratory reactor may fail, through inadequate mixing, poor heat removal, unexpected reaction byproducts, or thermal runaway risk, when scaled to a 10,000-liter production vessel. Physical scale-up trials are expensive, time-consuming, and in the case of hazardous reactions, potentially dangerous. CFD simulation of the reactor fluid dynamics, heat transfer, and mixing at full production scale de-risks the scale-up before the first production batch is attempted.
The primary simulation types are CFD for mixing and mass transfer in stirred tank reactors, heat transfer CFD for jacketed vessels and heat exchangers, pressure vessel FEA for process equipment structural integrity per ASME Section VIII, piping stress analysis per ASME B31.3, and explosion and consequence modeling for process hazard analysis (Gaussian dispersion modeling, blast overpressure prediction for facility layout).
Continuous Manufacturing and the FDA’s Process Analytical Technology Initiative
The FDA’s Process Analytical Technology (PAT) framework and Quality by Design (QbD) initiative have created a regulatory incentive for simulation in pharmaceutical manufacturing. Under QbD, manufacturers are encouraged to use mechanistic models, including CFD and FEA, to demonstrate understanding of the design space of their manufacturing process: how process parameters affect product quality attributes. A QbD submission supported by simulation models typically receives faster FDA review and allows greater manufacturing flexibility post-approval than a traditional empirical submission, because the simulation demonstrates that the manufacturer understands the process at a fundamental level rather than just having observed it empirically.
Frequently Asked Questions
Q: Which industry benefits most from simulation-driven design?
Aerospace and automotive are typically considered the highest-maturity and highest-volume users of simulation-driven design, but ‘most benefit’ depends on the metric. Aerospace has the highest regulatory integration, simulation is mandatory for certification. Automotive runs the highest simulation volume, major OEMs run hundreds of thousands of analyses per vehicle program. Medical devices have the highest regulatory leverage, simulation evidence can substitute for physical testing in FDA submissions. Oil and gas has the highest per-incident ROI, simulation preventing a single platform failure or pipeline rupture can save billions. The correct answer is industry-specific: simulation delivers its highest return wherever physical testing is most expensive, most time-consuming, most dangerous, or most regulated.
Q: How does simulation-driven design reduce prototype costs?
Simulation reduces prototype costs by identifying design problems before hardware is built, allowing engineers to evaluate dozens or hundreds of design variants digitally in the time and cost it would take to build and test one physical prototype.
cost asymmetry is large: a CFD simulation of a heat exchanger design costs a few hundred dollars in compute time and engineer hours; a physical prototype of the same heat exchanger costs $10,000 to $100,000 in materials, manufacturing, and test setup. Every design iteration that simulation handles, every geometry variant evaluated, every load case checked, every failure mode explored, is an iteration that does not require a physical build-and-test cycle. In mature simulation users, this translates to 40 to 70 percent fewer physical prototypes over the full product development program.
Q: Can simulation replace physical testing entirely?
No, and the goal of simulation-driven design is not to eliminate physical testing, it is to maximize the value of physical testing by using simulation to arrive at a better design before the first physical test. Physical testing validates simulation models, certifies final designs to regulatory standards, identifies failure modes that simulation did not predict, and provides the empirical data that makes simulation credible.
The appropriate relationship between simulation and testing is complementary: simulation explores the design space rapidly and cheaply, and physical testing validates the final design and the simulation itself. In the most mature industries (aerospace, automotive), regulatory frameworks explicitly define what simulation can replace (some physical test iterations in development) and what it cannot replace (final certification tests required by safety regulations).
Q: What is the ROI of simulation software investment?
Organizations that integrate simulation early into product development commonly report lower prototype costs, fewer design iterations, faster engineering cycles, and improved product quality. Lifecycle Insights has reported that organizations with mature digital engineering practices require fewer physical prototypes while improving project performance and profitability. The actual financial return depends on the industry, product complexity, regulatory requirements, and the cost of physical testing.
Q: How is simulation used in medical device FDA submissions?
The FDA accepts computational modeling and simulation (CM&S) results as part of premarket submissions (510(k) and PMA) under guidance issued in 2016 and updated subsequently. The acceptance framework requires that the simulation model be validated against physical test data for a similar geometry and loading condition, that the validation follows the ASME V&V 40 standard for medical device simulation credibility, and that the submission clearly defines the context of use, what questions the simulation is answering and what its limitations are.
When these conditions are met, simulation results can substitute for some physical bench tests (particularly parametric design exploration tests) and support the biological and performance characterization of the device. Simulation does not replace clinical trials or the final design verification testing required by 21 CFR Part 820.
Q: What simulation types are most commonly used across industries?
Structural finite element analysis (FEA) for stress, deformation, and fatigue is the most universally used simulation type, it appears in every industry on this list. Computational fluid dynamics (CFD) is the second most common, used wherever fluid flow, heat transfer, or aerodynamics matter: automotive aerodynamics, aerospace performance, oil and gas flow assurance, pharmaceutical mixing, maritime hull design, electronics cooling, and renewable energy resource assessment.
Thermal analysis (often combined with structural FEA for thermal stress) is third, particularly critical in electronics, power generation, and aerospace. Dynamic analysis (modal, harmonic, transient) is essential in automotive NVH, aerospace flutter, rotating machinery, seismic engineering, and renewable energy fatigue. The combination of structural FEA + CFD + dynamic analysis covers the majority of simulation work across all ten industries.
Conclusion:
The pattern across all ten industries is consistent: Organizations that have integrated simulation deeply into their engineering workflow consistently report improved product quality, reduced development risk, and more efficient product development processes. This is not coincidence. Simulation-driven design gives engineering teams the ability to explore design spaces that physical testing cannot reach economically, to find failure modes before they manifest in hardware, and to optimize performance dimensions that hand calculation cannot resolve. The competitive advantage this creates compounds over time as simulation models, validation databases, and process knowledge accumulate.
The common thread across aerospace, automotive, medical devices, oil and gas, civil engineering, electronics, consumer products, renewable energy, maritime, and pharmaceutical processing is the same economic logic: physical iteration is expensive, slow, and limited in scope; digital iteration is cheap, fast, and unlimited in scope. Every industry on this list has discovered, at different times, through different forcing functions, with different regulatory contexts, that the development process built on digital-first, physical-second is superior to the prototype-first, analysis-second process it replaced. The question for any engineering organization is not whether simulation-driven design delivers value, but how quickly it can be adopted at the depth and breadth that the leading competitors have already reached.
The simulation types, the regulatory frameworks, the specific use cases, and the ROI metrics differ by industry. But the direction of travel is uniform: more simulation, earlier in the design process, integrated more tightly with the physical testing that validates it, applied to a wider range of design decisions. The industries that are ahead of this curve are setting the product performance benchmarks that the rest of their sectors must meet.
Deepen your simulation knowledge with our technical guides on FEA boundary conditions, static vs dynamic analysis, stress concentration, mesh quality, and the common errors that make simulation results unreliable.
- Lifecycle Insights. ROI of Digital Transformation Benchmark Report. 2021. ↩︎
Leave a Reply