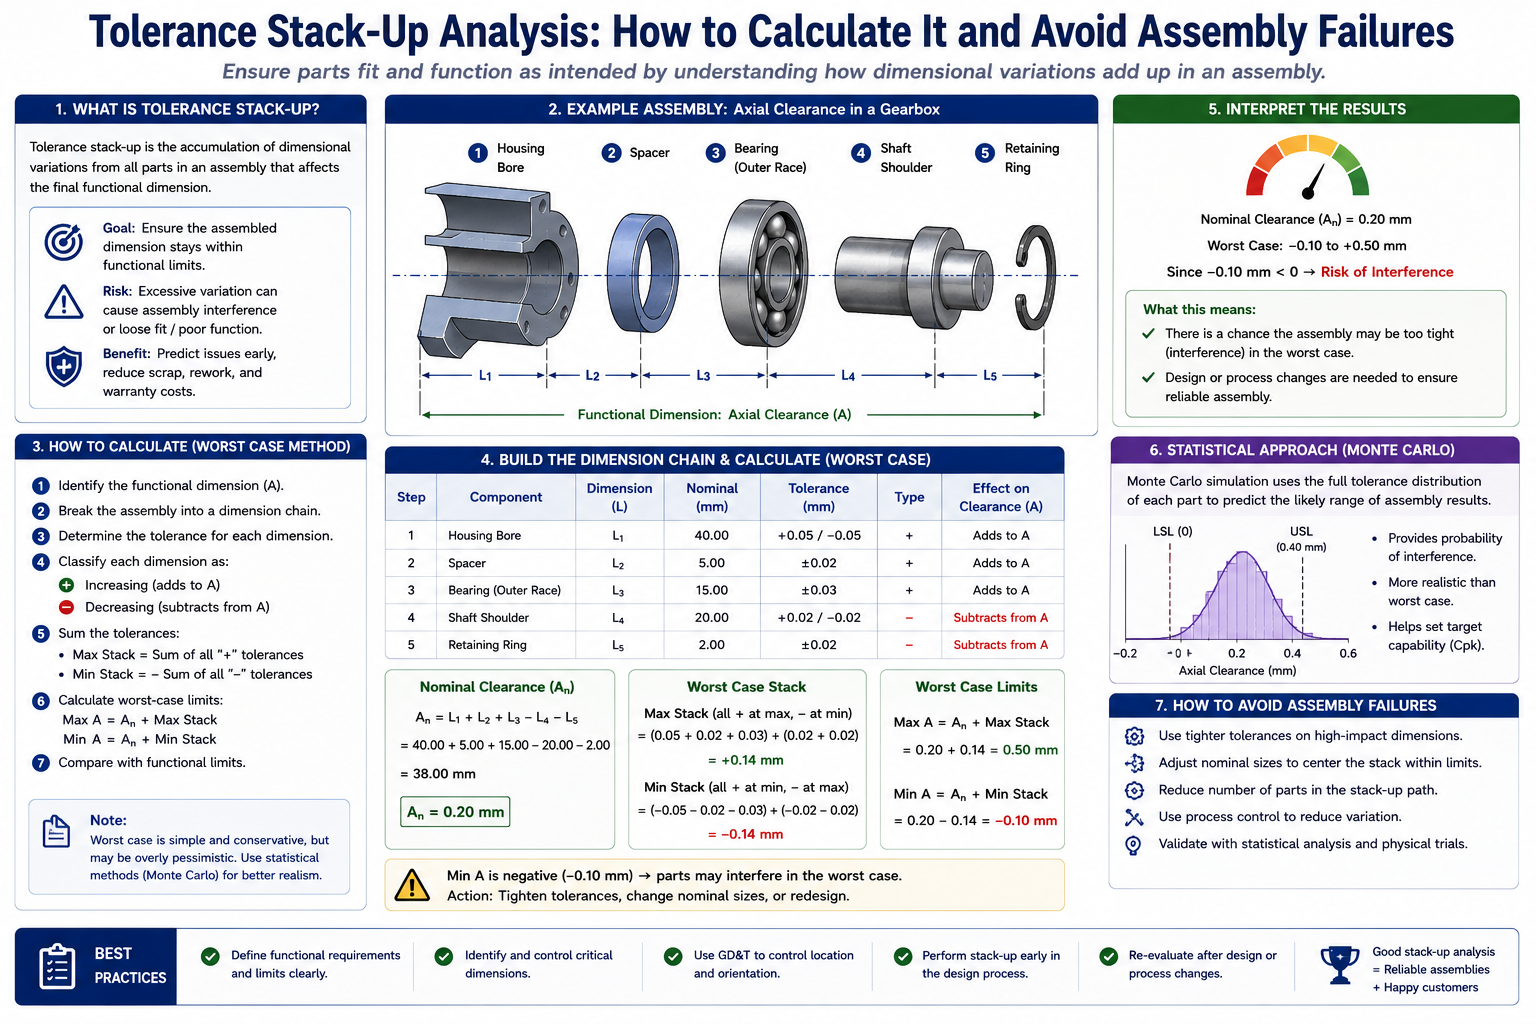
A gearbox housing kept failing its final assembly check. Not often, maybe one unit in forty, but often enough to stop the line every shift over a shaft that wouldn’t seat against its retaining ring. Every individual part had passed inspection. Every dimension on every drawing sat within its stated tolerance stack up.
The engineering team spent two weeks chasing a phantom defect before someone laid all five parts in the stack-up out on a bench, added up their tolerances by hand, and found the answer. The design had been toleranced as if the parts would average out around nominal, but nobody had checked what happened if four of the five parts landed near the same edge of their range at once. When that happened, a small but real fraction of the time, the stack came up short by just over a tenth of a millimetre, and the shaft wouldn’t seat.
| Quick answer: Tolerance stack-up is the accumulated effect of individual part tolerances on a final assembled dimension. It’s one of the most common ways a product that looks correct on every individual drawing still fails when the parts come together, because no single part is wrong; the problem lives in how several correct tolerances combine. The four standard calculation methods are worst-case, RSS (root sum square), Cpk-adjusted statistical analysis, and Monte Carlo simulation, and choosing between them is a real engineering decision with direct cost and quality consequences. |
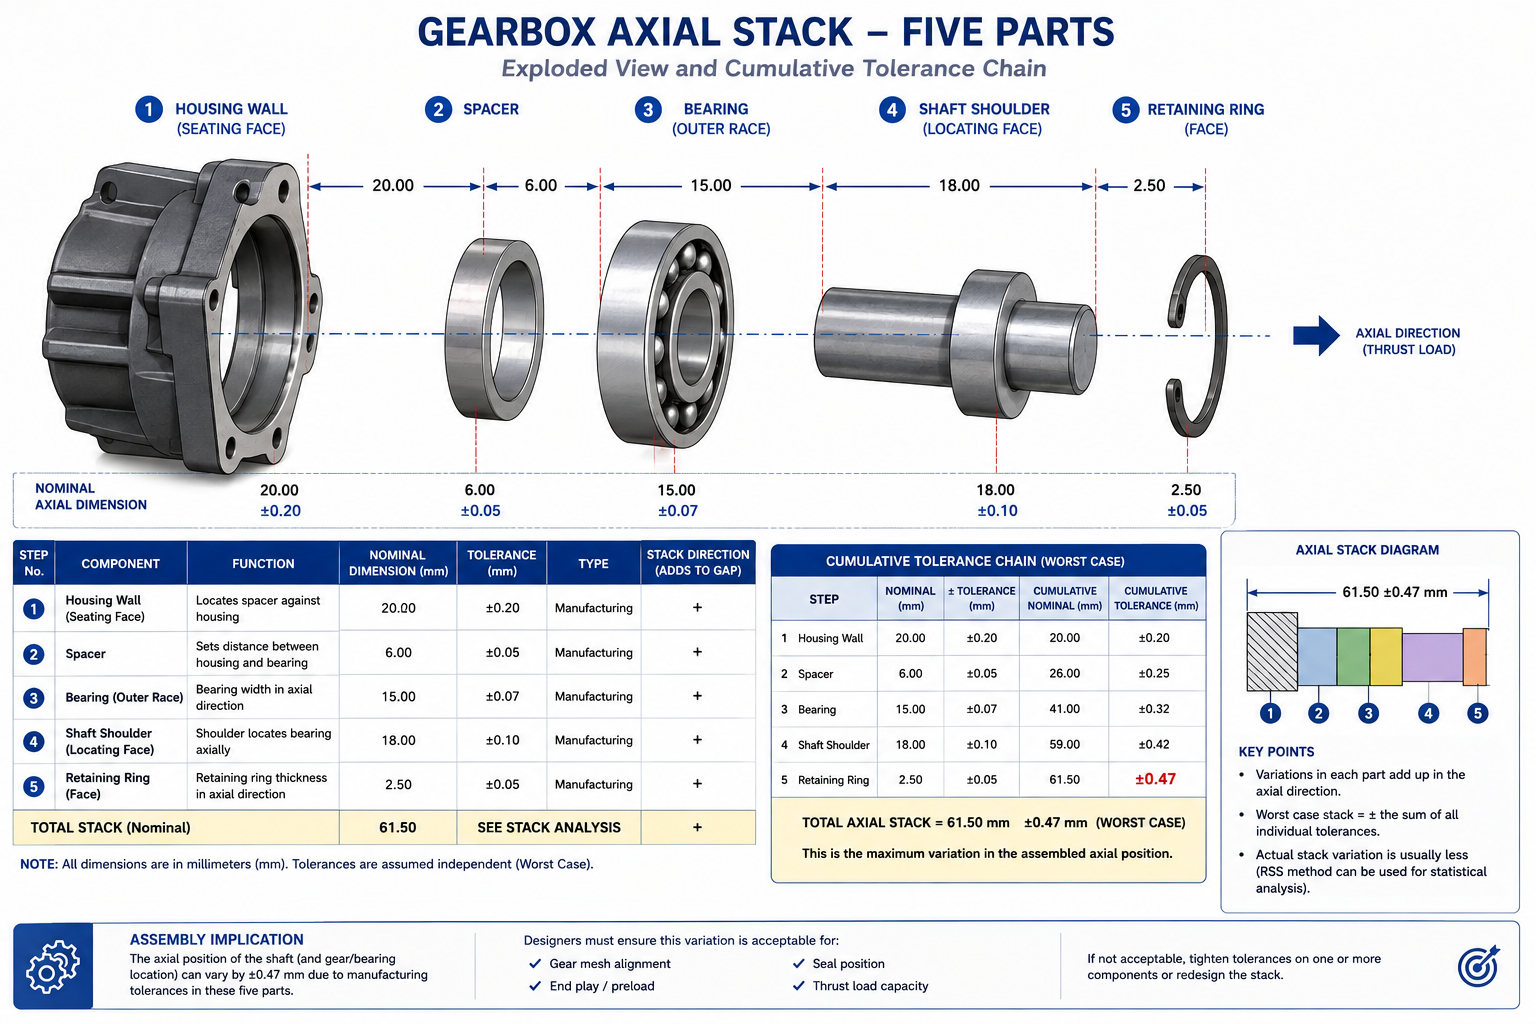
[Image suggestion 1: An exploded-view diagram of the five-part gearbox axial stack (housing wall, spacer, bearing, shaft shoulder, retaining ring) with dimension callouts and arrows showing the cumulative tolerance chain. Alt text: “Exploded diagram of a five-part gearbox tolerance stack-up showing housing, spacer, bearing, shaft, and retaining ring dimensions”]
What a Tolerance Stack-Up Actually Is
Every dimension on a drawing has a tolerance, a permitted range of variation around nominal. On its own, that tolerance describes how much one feature on one part can vary and still be acceptable. A stack-up happens whenever an assembled dimension, a gap, a clearance, an alignment, depends on more than one of those individually toleranced dimensions adding together. The assembled dimension inherits variation from every contributor in the chain, and a stack-up calculation answers a single question: how much can that final dimension actually vary, given everything feeding into it?
The gearbox chain had five links: housing wall location, spacer thickness, bearing width, shaft shoulder position, and retaining ring thickness. Each tolerance was individually reasonable and individually achievable. None of them was the problem. The problem was that nobody had calculated what all five could produce in the worst case, and the design was sized as though nominal values alone would always be close enough.
This is the trap that catches engineers comfortable with individual part tolerancing but who haven’t built the habit of tracing assembled dimensions back through every contributor. A stack-up isn’t a single calculation done once. It’s a discipline: identify every dimension contributing to a critical assembled feature, decide how those contributions combine, and check the result against what the assembly actually needs. Skip any one of those steps and the calculation, even with correct arithmetic, won’t tell you what you need to know.
Four Ways to Calculate a Stack-Up
There’s more than one accepted way to combine individual tolerances into a predicted range for the final assembled dimension, and the methods don’t agree with each other. Two engineers looking at the same five-part gearbox stack could reach different conclusions about whether the design is safe, depending entirely on which method they used.
| Method | Formula (linear stack) | What It Assumes | Resulting Range | When to Use |
|---|---|---|---|---|
| Worst-case (arithmetic) | T_total = T1+T2+…+Tn | Every dimension simultaneously at its limit, worst combination, every time | Widest possible; guarantees 100% fit but most conservative and expensive | Safety-critical interfaces, low-volume production, first-pass feasibility |
| Statistical (RSS) | T_total = sqrt(T1²+T2²+…+Tn²) | Each dimension varies independently, roughly normal distribution | Typically 40-60% tighter than worst-case for 4+ dimensions | Medium/high volume with statistically stable independent processes |
| Six Sigma (Cpk-adjusted RSS) | T_total = sqrt(sum((Ti/Cpki)²)) | Each input has a known or assumed process capability, not just a tolerance | Tighter or looser than basic RSS depending on real Cpk | Mature processes with historical Cpk data; automotive, medical, aerospace |
| Monte Carlo simulation | Numerical: thousands of randomized trials | Each input’s actual distribution shape is known or reasonably estimated | Most accurate real-yield representation; handles non-linear stacks | Complex assemblies with 6+ contributors or non-normal distributions |
Worst-Case: Simple, Safe, and Often Too Expensive
The worst-case method is the one most engineers learn first because the logic is completely intuitive: add every plus tolerance for the maximum stack, every minus tolerance for the minimum, and you have a guaranteed range covering every physically possible part combination. If the assembly works at both ends of that range, it works no matter what actually gets built. No statistical assumption hides in the background. It’s a hard guarantee.
The cost of that guarantee grows quickly as more dimensions join the chain. In reality, the chance that five independent parts all land at the same tolerance edge simultaneously is vanishingly small, smaller as more parts join the stack. Worst-case tolerancing protects against an outcome that’s real but rare for most production processes. That protection is worth paying for on a safety-critical aerospace joint, and much harder to justify on a cosmetic gap that would be far cheaper to fix with a slightly tighter tolerance somewhere else in the chain.
RSS: Letting Statistics Do the Work
RSS takes a different view of the same problem. Instead of assuming every part lands at its tolerance extreme simultaneously, it assumes each dimension varies independently around its own nominal, the way a real, statistically stable process actually behaves. Most parts come out close to nominal. Fewer land near the limits. The chance that several independent dimensions all land at an extreme together is much lower than the chance that any single one does, and RSS reflects that by combining tolerances as the square root of the sum of squares rather than a simple sum.
The result is almost always tighter than worst-case, often forty to sixty percent tighter once a stack has four or more contributors. That’s exactly why RSS is attractive: it predicts, correctly for processes that actually behave this way, that the assembled result varies less than worst-case suggests. The catch is real: RSS only holds up if the assumption is true. If a contributing process isn’t statistically stable, or if two dimensions in the stack aren’t actually independent because they come from the same tool or fixture, RSS understates the real variation, and a gearbox-style failure becomes a possibility the calculation never warned anyone about.
Cpk-Adjusted Statistical Methods: Bringing Real Process Data In
Basic RSS treats every contributing dimension as if its real variation exactly fills its stated tolerance band. In practice that’s rarely true. A mature, well-controlled process often clusters much more tightly around nominal than the tolerance alone suggests, while a newer process might run close to its limits. Process capability, expressed as Cpk, captures that difference.
| Cpk Value | Sigma Level | Defect Rate (PPM) | What It Means | Typical Process Maturity |
|---|---|---|---|---|
| 0.67 | 2 sigma | ~22,750 ppm (2.3%) | Process spread nearly fills the band; frequent defects expected | New or poorly controlled; pilot run before optimisation |
| 1.00 | 3 sigma | ~1,350 ppm | Spread just fits under ideal centring; any drift causes defects | Marginal control; acceptable for low-consequence features |
| 1.33 | 4 sigma | ~32 ppm | Comfortable margin; industry-common minimum target | Standard for general automotive/industrial components |
| 1.67 | 5 sigma | ~0.6 ppm | Strong margin even with some drift | High-reliability, safety-critical automotive/aerospace |
| 2.00 | 6 sigma | ~0.002 ppm | Variation a small fraction of the band; defects effectively eliminated | Six Sigma mature; semiconductor, medical, aerospace critical |
Using actual Cpk data instead of a flat industry-default value changes the calculation meaningfully. A dimension running at Cpk = 2.0 barely uses its tolerance band and contributes very little real variation, while one at Cpk = 1.0 fills its band almost completely. A stack-up treating both the same, assuming a uniform Cpk across every contributor, will be wrong in one direction or the other. The only way to know which is to look at the actual process data, following the process capability framework laid out in the AIAG Statistical Process Control reference manual, rather than assume it.
Monte Carlo: When the Maths Gets Too Complicated for a Formula
Worst-case and RSS work cleanly for simple linear chains, but real assemblies aren’t always that simple. Some stack-ups involve trigonometric relationships, angular tolerances combining with linear ones, or contributors whose distribution isn’t close to normal, none of which fits neatly into the RSS formula. Monte Carlo sidesteps the problem entirely: it randomly samples each contributing dimension thousands of times according to its actual or assumed distribution, calculates the resulting assembled dimension for every random combination, and builds a complete picture of the likely outcome from the simulated results directly.
The advantage is that Monte Carlo handles almost any complexity, non-linear relationships, mixed distribution shapes, correlated inputs, without needing a closed-form formula for the specific geometry. The cost is that it requires dedicated tolerance analysis software or custom calculation setup, and the result is only as good as the distribution assumptions fed into it. For complex assemblies with six or more contributing dimensions, or stacks mixing angular and positional tolerances with linear ones, Monte Carlo is usually the most trustworthy method available.
Read more on: Design for Manufacturability (DFM) Checklist for Engineers (20-Point)
A Worked Calculation: The Gearbox Stack-Up Revisited
Laying out the five contributing dimensions and running each method is exactly the exercise that would have caught the gearbox problem before it reached the assembly line.
CONTRIBUTING DIMENSIONS (mm):
  Housing wall to bearing seat:    25.00 +/- 0.10
  Spacer thickness:                 5.00 +/- 0.05
  Bearing width:                   12.00 +/- 0.08
  Shaft shoulder position:          8.00 +/- 0.06
  Retaining ring thickness:         2.00 +/- 0.03

NOMINAL STACK: 25.00 + 5.00 + 12.00 + 8.00 + 2.00 = 52.00 mm
Required clearance for correct seating: 52.00 mm +0.05 / -0.00

METHOD 1: WORST-CASE
  T_total = 0.10 + 0.05 + 0.08 + 0.06 + 0.03 = 0.32 mm
  Predicted range: 51.68 to 52.32 mm
  Against required +0.05/-0.00: EXCEEDS limit in worst case

METHOD 2: RSS (Cpk = 1.33 assumed, normal distribution)
  T_total = sqrt(0.10²+0.05²+0.08²+0.06²+0.03²) = sqrt(0.0234) = 0.153 mm
  Predicted range: 51.85 to 52.15 mm
  Against required +0.05/-0.00: STILL EXCEEDS the +0.05 limit

WHAT THIS REVEALS:
  Even the more forgiving RSS prediction (0.153mm) exceeds the
  functional requirement (0.05mm). This is not a method problem,
  it is a genuine design problem: the individual tolerances are
  too loose for the function.

CORRECTIVE ACTION TAKEN:
  Bearing width tightened from +/-0.08 to +/-0.03 (tighter-spec bearing)
  Housing wall tightened from +/-0.10 to +/-0.05 (reaming vs. as-drilled)
  New RSS: sqrt(0.05²+0.05²+0.03²+0.06²+0.03²) = 0.102mm
  Still tight vs. +0.05/-0.00 -- requires selective assembly
  or further tightening; escalated for design review
Every one of the five original tolerances was perfectly reasonable on its own drawing. None would have raised a flag in an isolated review. It was only adding them together, in the actual functional direction they combine, that revealed the design couldn’t meet its own clearance requirement. That revelation is the entire value of a stack-up calculation.
How Stack-Up Errors Show Up in Real Products
The same underlying problem, accumulated variation across a chain of dimensions, shows up differently depending on what’s being built.
| Industry / Product | Example Stack-Up | Consequence | Typical Method Used |
|---|---|---|---|
| Automotive body-in-white | Door gap/flush: panel, hinge, striker, body opening | Visible gaps, wind noise, water leaks, warranty claims | RSS or Six Sigma Cpk-adjusted; Cpk >= 1.33 typical |
| Medical device (drug delivery) | Plunger travel in an auto-injector | Incorrect dose; patient safety risk; recall potential | Worst-case for dose-critical stack; statistical with validation data |
| Aerospace structural assembly | Wing spar to rib hole position stack | Fastener misalignment, induced stress, reduced fatigue life | Worst-case for primary structure per certification |
| Consumer electronics enclosure | Button travel and seal compression stack | Mushy button feel; failed water resistance rating | RSS for cosmetic; worst-case for IP-rated sealing |
| Industrial gearbox | Gear mesh centre distance stack | Incorrect backlash; premature wear, noise, tooth fracture | RSS or Cpk-adjusted, validated against measured backlash |
| Furniture / flat-pack | Cam-lock and dowel hole alignment | Visible misalignment, wobble, difficulty assembling | Worst-case for visible features; RSS elsewhere |
Why Automotive Panel Gaps Are the Textbook Example
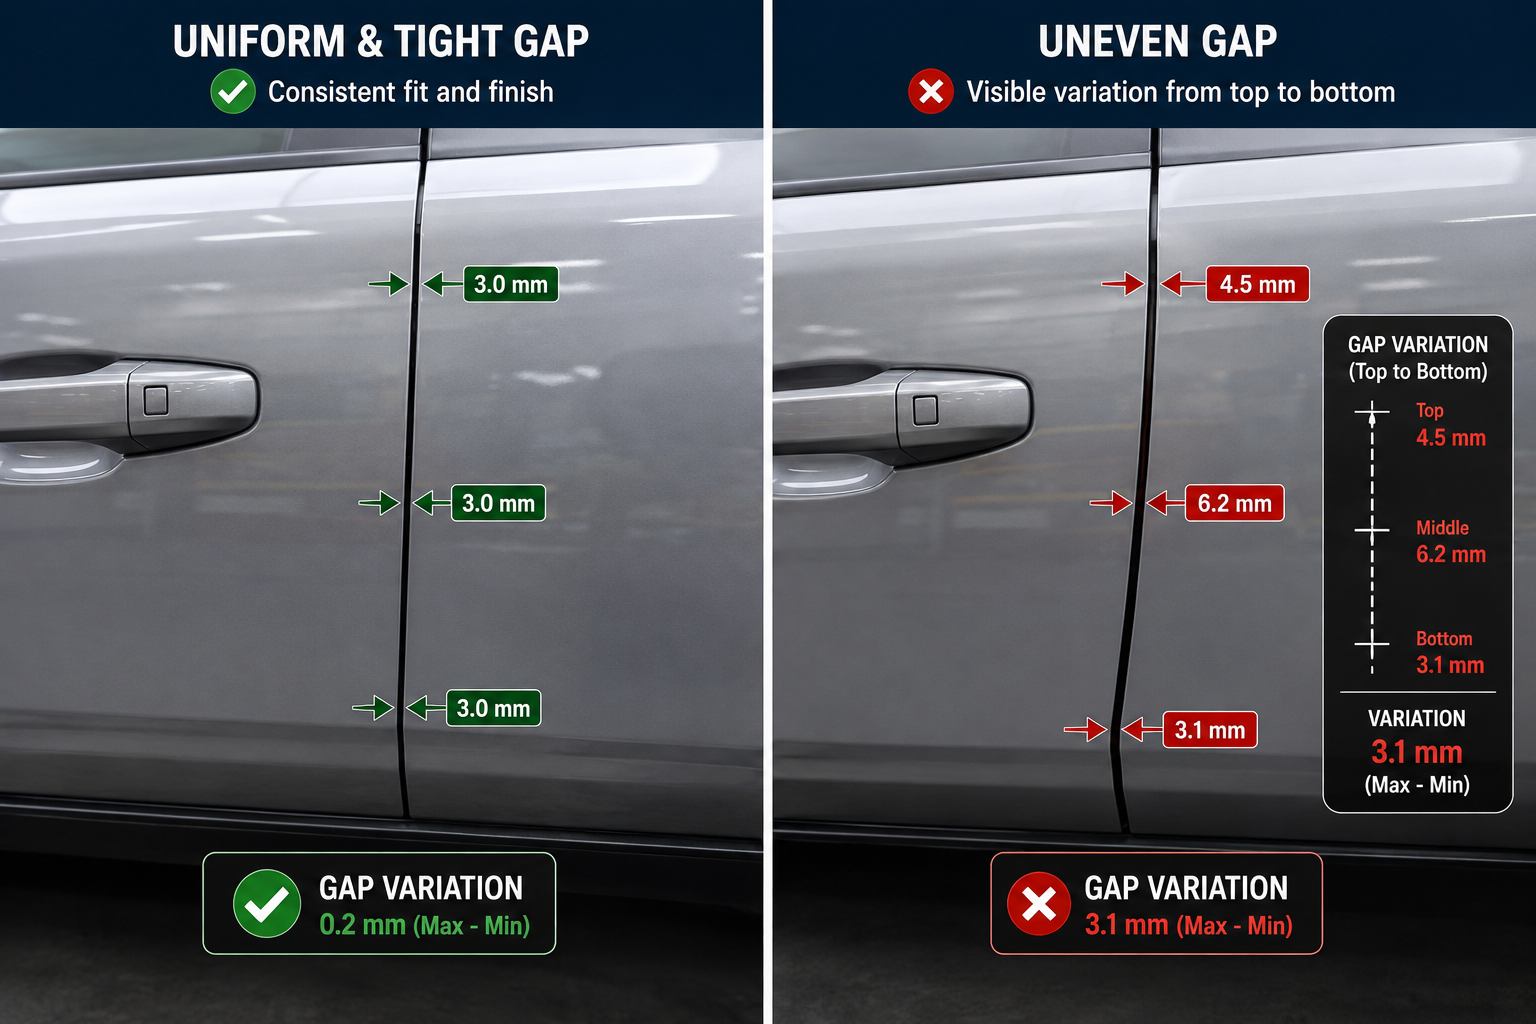
Door gaps and panel flush conditions are among the most visible, most photographed examples of tolerance stack-up in everyday life, because the human eye is extremely sensitive to uneven gaps between adjacent panels. A door gap varying from 4mm at the top to 6mm at the bottom is immediately obvious to a customer, even though both values might individually sit within a reasonable-looking tolerance.
That sensitivity is exactly why automotive OEMs push hard on statistical process control and Cpk targets for body panel dimensions. The stack-up producing a door gap runs through the body structure, hinge, striker, and door panel, and a worst-case approach applied to that whole chain would require individual tolerances so tight the parts would be prohibitively expensive at automotive volumes. The only way to hit both the cosmetic requirement and a sane production cost is statistical tolerancing backed by real, monitored process capability, which is why Cpk targets of 1.33 or higher on body panel dimensions are standard rather than an unusual aspiration.
Common Mistakes That Undermine a Stack-Up Calculation
A stack-up calculation can be arithmetically correct and still mislead, because the maths is only as good as the assumptions and completeness feeding into it.
| Mistake | Why It Happens | Consequence | Fix |
|---|---|---|---|
| Mixing worst-case and statistical dimensions without flagging it | Different engineers contribute dimensions without agreeing on a shared method | Result is neither a valid worst-case bound nor a valid statistical estimate | Agree on the method per chain before dimensions are finalised; document it |
| Leaving out a contributor because it “shouldn’t matter” | Stack diagram built from the drawing without a deliberate walk of every contact | Calculated tolerance is optimistic; real assemblies show more variation | Build the stack from a physical or simulated walk of the actual load path |
| Treating a bilateral tolerance as one number instead of plus/minus | Quick mental math collapses +/-0.1 into 0.1 without tracking direction | Sign errors that understate or overstate the range, sometimes by 2x | Carry plus and minus contributions separately; use tools that enforce this |
| Assuming RSS without verifying independence and normal distribution | RSS is the default in most software, applied without checking assumptions | Correlated dimensions (shared tooling/fixture) make RSS understate variation | Identify shared process dependencies first; use Monte Carlo if correlated |
| Using Cpk = 1.33 for every dimension regardless of real history | It’s the common default and easier than pulling real capability data | Calculated yield is fictional if a process actually runs lower | Pull actual Cpk data wherever it exists; flag assumed values explicitly |
| Stacking only nominal dimensions and ignoring GD&T | Linear stacks are easier to set up than full GD&T-based stacks | Assemblies fail even when every linear dimension is in tolerance | Include position, perpendicularity, and flatness as contributors |
The Independence Assumption Is the One Worth Double-Checking Most
Assuming statistical independence when it doesn’t actually exist is probably the mistake that causes the most damage while being hardest to spot from drawings alone. RSS and Cpk-adjusted methods both depend on each contributing dimension varying independently of the others. That holds reasonably well when each dimension comes from a genuinely separate process, machine, or setup.
It breaks down when two or more dimensions in the same stack are produced on the same fixture, machined in the same setup, or molded in the same cavity, because whatever makes that shared process drift, tool wear, thermal expansion, fixture wear, tends to push those dimensions in a correlated direction rather than randomly and independently. A stack-up treating correlated dimensions as independent understates real variation, sometimes significantly, which is exactly the gap between calculation and reality that produced the gearbox failure. The fix: before defaulting to RSS, ask whether any two contributors share a fixture, a tool, or a process step, and treat those as correlated if they do.
Building Stack-Up Analysis Into the Design Process
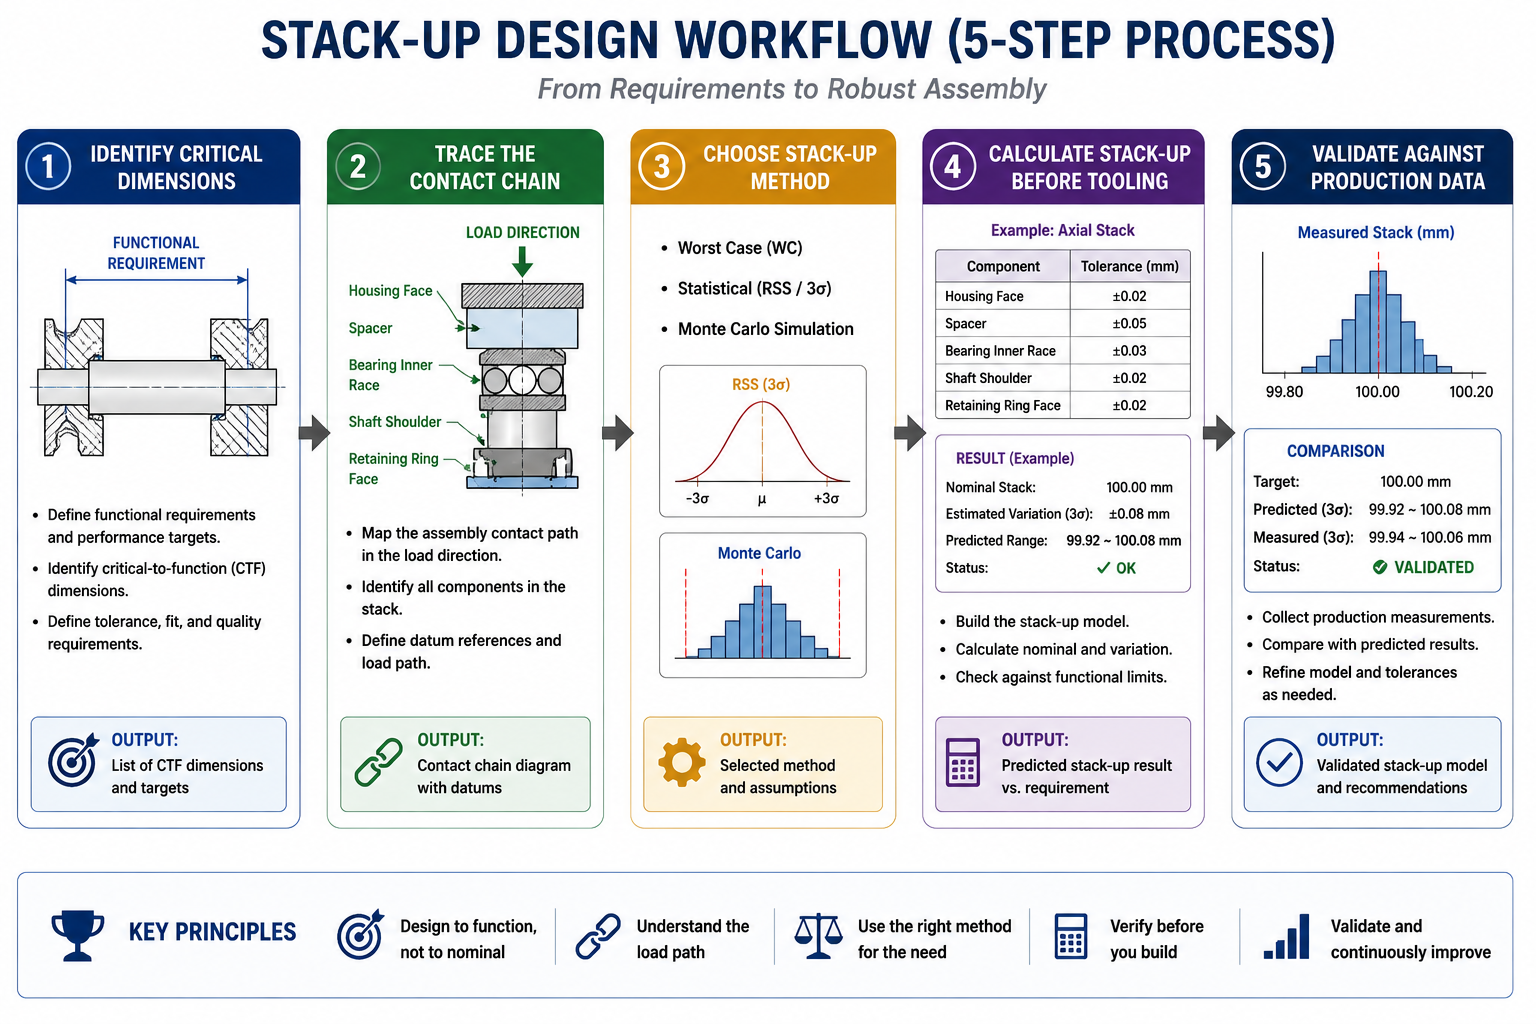
The gearbox failure wasn’t caused by a lack of skill. It was caused by the stack-up calculation simply not happening until after parts were already failing on the line. The fix isn’t a better formula, it’s a process change: deciding, as a matter of routine, which assembled dimensions warrant a formal stack-up calculation, and doing it before tooling is committed rather than after a quality problem forces the question.
- Identify the critical assembled dimensions first. Walk the assembly and identify every gap, clearance, or alignment that actually matters functionally or cosmetically, deliberately rather than after a failure.
- Trace the actual contact chain for each critical dimension. Trace every part, feature, and contact surface that physically contributes, the way the gearbox team eventually did on the bench. This step gets skipped or done from memory more often than any other.
- Choose a stack-up method deliberately, and document the choice. Base it on the consequence of failure and the maturity of the contributing processes, and write the decision down.
- Calculate before tooling, not after. Run it while the design is still in CAD and individual tolerances can still be adjusted cheaply.
- Validate against real measured data once production starts. Compare the actual assembled dimension to the prediction, and use any gap to correct the assumptions feeding future stack-ups.
The minimum question to ask before releasing any assembly drawing: if every contributing dimension landed at the worst end of its tolerance simultaneously, would this still function? If the honest answer is no, and the design is relying on statistics to save it, that reliance needs to be a deliberate, documented decision, not an assumption nobody checked.
Frequently Asked Questions
What is the difference between worst-case and statistical tolerance stack-up? Worst-case adds up every individual tolerance directly, guaranteeing the assembly works for every physically possible part combination, but the predicted range grows quickly as dimensions join the chain, usually demanding tighter and more expensive individual tolerances. RSS assumes each dimension varies independently around nominal and combines tolerances as the square root of the sum of squares, producing a tighter, more realistic range, but only if the dimensions are genuinely independent and statistically stable.
When should I use worst-case instead of RSS for a stack-up? Use worst-case when the consequence of an out-of-tolerance assembly is severe: safety-critical interfaces, low-volume production, or any case where reliable process capability data isn’t available. Use RSS or Cpk-adjusted methods when volume is high enough that the processes are genuinely stable, the consequence of an occasional miss is manageable, and you can support the independence assumption. Many designs mix both: worst-case for the dimensions that matter most, RSS for the rest of the same stack.
What does Cpk actually measure and why does it matter for stack-up? Cpk measures how well a process’s actual output variation fits within the specified tolerance band, accounting for how centred the process is on nominal. A Cpk of 1.33 leaves a comfortable margin, roughly 32 defects per million. A Cpk of 1.0 barely fits the band, roughly 1,350 defects per million, with little margin for drift. Cpk matters because basic RSS assumes every dimension’s variation fills its tolerance band evenly, which is rarely true. Folding in real Cpk data lets the prediction reflect how parts are actually being made.
How many dimensions need to be in a chain before stack-up becomes a real concern? There’s no fixed number; it depends on the size of each tolerance relative to the functional requirement, not just the dimension count. As a practical rule, any assembled dimension built from three or more individually toleranced contributors deserves a deliberate calculation rather than an assumption that nominal values will be close enough. A five-part stack feeding a tight clearance, like the gearbox example, almost always needs one.
Can a tolerance stack-up calculation be wrong even if the arithmetic is correct? Yes. The arithmetic in a worst-case or RSS calculation is simple and rarely the source of error. The calculation goes wrong when the inputs are wrong: a contributor left out because it seemed unimportant, an assumed Cpk that doesn’t match the real process, an independence assumption applied to dimensions that actually share a fixture, or a sign error from collapsing a bilateral tolerance without tracking direction. A stack-up is only as trustworthy as the completeness and accuracy of what feeds into it.
Is Monte Carlo simulation always better than RSS for tolerance analysis? Not always, though it’s more broadly capable. RSS is fast, needs no special software, and gives a perfectly good answer for simple linear stacks with normally distributed, independent inputs, which describes a large share of real-world stack-ups. Monte Carlo earns its extra setup cost for non-linear relationships, non-normal distributions, or enough contributors and complexity that a closed-form RSS formula becomes difficult to set up correctly. For a five-part linear stack like the gearbox example, RSS is entirely adequate; for a complex multi-axis assembly mixing angular, position, and linear tolerances, Monte Carlo is usually more trustworthy.
Key Takeaways
Every individual dimension on every drawing in the gearbox assembly was correct. That’s exactly what makes tolerance stack-up worth taking seriously: it’s one of the few places in engineering where every individual piece of work can be done right and the overall result can still fail, because nobody added the pieces together and checked. The product didn’t fail from a mistake on a drawing. It failed because the relationship between five correct drawings was never examined.
Worst-case, RSS, Cpk-adjusted analysis, and Monte Carlo simulation aren’t competing answers to the same question. They’re different tools suited to different situations, and choosing between them is itself an engineering decision deserving the same deliberate attention as any individual tolerance. They all share the same purpose: turning a collection of individually reasonable tolerances into an honest answer about whether the assembled product will actually work, calculated before tooling is cut, not discovered after parts are already failing on the line.
Leave a Reply