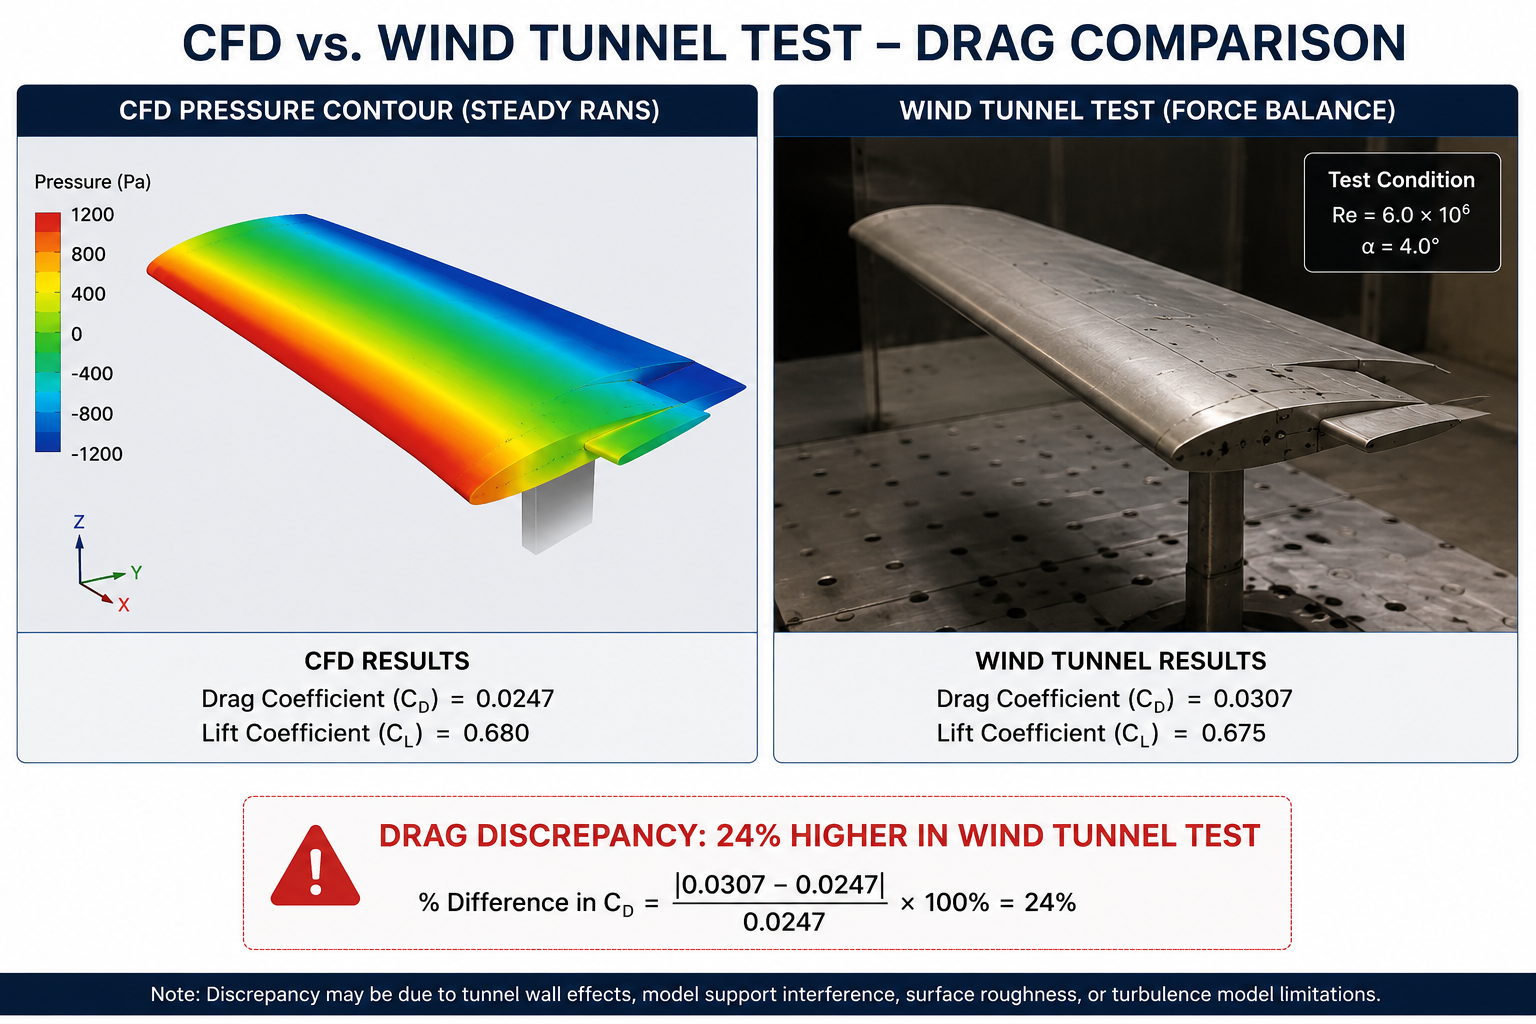
A recent CFD run took four days to set up and 16 hours to run on a 128-core cluster. The predicted drag coefficient was 0.287. The wind tunnel measurement for the same configuration was 0.231. That’s a 24 percent error, and it had nothing to do with turbulence model uncertainty or geometry mismatches.
The real cause was three stacked setup errors: a domain that ended too soon behind the wing, a first-cell y+ value stuck in the unreliable buffer layer, and a convergence call made from residuals alone while the drag coefficient was still drifting. Each error alone would have cost 5 to 10 percent accuracy. Together, they made the result useless for the design decision it was meant to support.
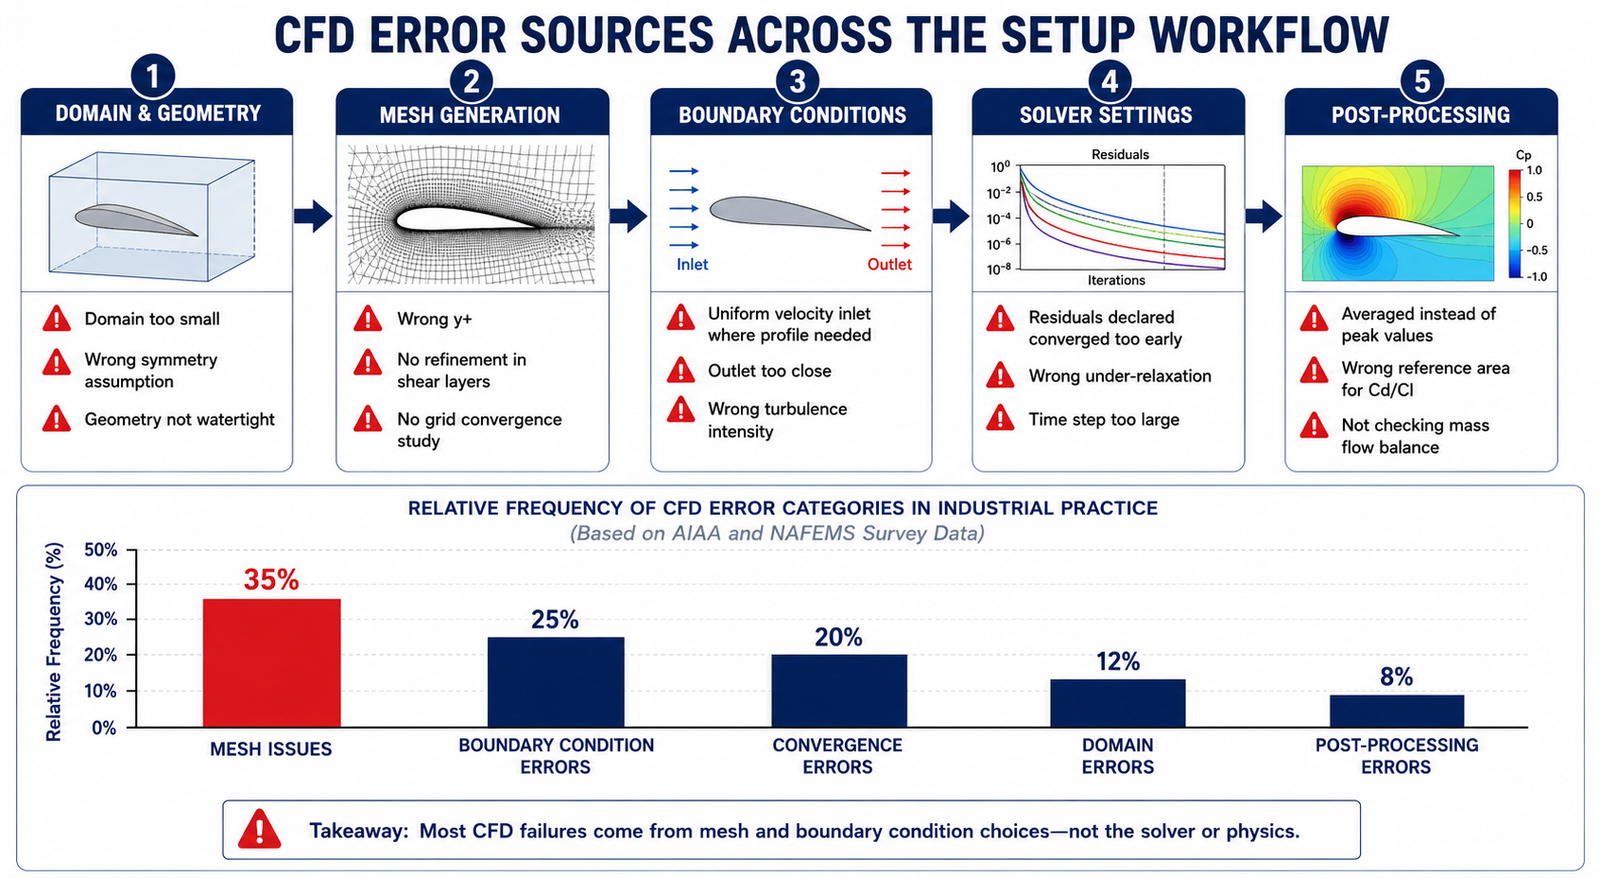
Quick answer: The most common CFD setup mistakes fall into five categories: domain and geometry, mesh quality, boundary conditions, solver settings and convergence, and post-processing. None of them show up as solver errors. The simulation still converges, the plots still look smooth, and the numbers still look plausible. That’s what makes them dangerous, and why systematic checking, not visual inspection, is the only reliable way to catch them.
CFD setup mistakes happen before the solver ever runs, in decisions about domain size, mesh topology, boundary conditions, and solver parameters. Like FEA preprocessing errors, they produce output that looks completely valid: smooth contours, stable force coefficients, clean convergence histories. The solver never flags them. Only systematic verification, domain independence, mesh independence, y+ checks, mass conservation, and monitored-quantity convergence, can catch them before a bad result reaches a design review.
The 20 Most Common CFD Setup Mistakes at a Glance
The table below lists all 20 mistakes by category, typical error magnitude, how to detect them, and priority. Critical items produce errors above 10 percent and cannot be trusted without correction. High priority items introduce meaningful risk that compounds with other errors. Medium items are good practice that improves reliability and prevents downstream post-processing problems.
| # | Mistake | Category | Typical Error | Detection Method | Priority |
|---|---|---|---|---|---|
| 1 | Domain too small | Domain / Geometry | 5–30% in force coefficients | Extend boundaries and rerun; compare results | Critical |
| 2 | Wrong turbulence model for the regime | Physics | 10–50% drag error in separated flow | Compare RANS vs DES/LES against test data | Critical |
| 3 | y+ wrong for the near-wall model | Mesh | 10–40% skin friction error | Check y+ distribution post-solve | Critical |
| 4 | Insufficient mesh in shear layers/wakes | Mesh | 10–40% wake drag error | Grid convergence study | Critical |
| 5 | Wrong inlet turbulence intensity/length scale | Boundary Conditions | 5–20% error in transition/separation | Match Tu and length scale to real conditions | High |
| 6 | Outlet too close to the body | Boundary Conditions | Divergence or false backflow | Move outlet 10–20 diameters downstream | Critical |
| 7 | Symmetry plane on asymmetric flow | Boundary Conditions | Fundamentally wrong result | Verify symmetry with a full-domain reference run | Critical |
| 8 | Wrong pressure-velocity coupling scheme | Solver Settings | Slow convergence or divergence | Use COUPLED for high-Re external aero | High |
| 9 | Convergence declared from residuals alone | Convergence | 5–25% error | Monitor lift, drag, and mass flow vs. iteration | Critical |
| 10 | Too few iterations for steady state | Convergence | Scattered, unstable averages | Run until monitors vary < 0.1% over 200 iterations | High |
| 11 | Wrong reference area/velocity for Cd/Cl | Post-processing | Error equal to the ratio of areas used | Document reference values before computing | High |
| 12 | Averaged instead of peak values reported | Post-processing | 10–40% under-reporting at peaks | Use unaveraged, cell-centred values at critical points | High |
| 13 | Wall functions applied at y+ < 30 | Mesh | 10–30% skin friction over-prediction | Target 30 < y+ < 300 for wall functions | High |
| 14 | Missing refinement at leading/trailing edges | Mesh | Wrong pressure distribution, circulation | Cluster mesh at stagnation and wake regions | High |
| 15 | Periodic BC on non-periodic flow | Boundary Conditions | Artificial forced periodicity | Verify true periodicity before applying | Medium |
| 16 | Wrong fluid properties at operating temperature | Physics | Re error scales all downstream results | Compute Re from actual target conditions | High |
| 17 | Time step too large in transient runs | Solver Settings | Aliased or missed unsteady features | Keep Courant number in the recommended range | High |
| 18 | Mass flow imbalance not checked | Convergence | Non-physical pressure and force fields | Confirm imbalance < 0.1% of inlet mass flow | Critical |
| 19 | Default under-relaxation for all cases | Solver Settings | Divergence or oscillation | Reduce to 0.3–0.5 for difficult problems | Medium |
| 20 | No grid convergence study | Mesh | Unknown discretisation error | Run coarse/medium/fine mesh; report GCI | Critical |
Category 1: Domain Size and Geometry
Domain size errors are the hardest CFD mistakes to catch from a single run. A domain that’s too small still converges cleanly and looks physically reasonable. The error only surfaces when you enlarge the domain and the results shift, or when you compare against test data and find a systematic bias.
Mistake 1: Domain Too Small
The downstream extent is the dimension analysts underestimate most. If the outlet boundary intersects the wake, or the body’s pressure field reaches it, the outlet condition distorts pressure around the body and skews the drag prediction. Lateral extents should keep blockage ratio below roughly 5 percent.
How to check it: run the original domain, then extend every boundary by 50 percent and rerun. If drag or lift changes by more than 1 percent, the domain was too small. This domain independence study should be standard practice before any result is reported.
| Flow Configuration | Inlet Distance | Outlet Distance | Lateral Extent | Top/Bottom Extent |
|---|---|---|---|---|
| External aerofoil/wing (2D) | 10–15 chords | 20–30 chords | 10–15 chords | 10–15 chords |
| External body (car, building), 3D | 5–10 lengths | 15–20 lengths | 5 widths each side | 5 heights + ground clearance |
| Internal duct/pipe flow | 10–20 diameters | 30–50 diameters | Wall boundary | Wall boundary |
| Bluff body (cylinder, facade) | 10 diameters | 30–40 diameters | 10 diameters each side | 10 diameters |
| Turbomachinery blade passage | 1–2 chords | 2–3 chords | Periodic at blade pitch | Periodic or hub/tip wall |
| Wind over terrain (ABL) | 5–10 building heights | 15–20 building heights | 5 heights each side | 6 heights or to gradient height |
Mistake 7: Symmetry Applied to Asymmetric Flow
A symmetry plane halves the computational cost, but only when the physics is genuinely symmetric. Many flows that look symmetric aren’t. A cylinder produces an alternating vortex street. A sphere develops an off-axis wake at moderate Reynolds number. A wing at high angle of attack can separate asymmetrically even with symmetric geometry.
Forcing symmetry on an asymmetric flow produces wrong separation onset, wrong stall angle, and often solver oscillation as it fights the imposed constraint. Test it with a full-domain run and no symmetry plane. If the result is symmetric to within 0.1 percent, the assumption holds.
Category 2: Mesh Quality and Refinement
Mesh errors cause roughly 35 percent of all CFD accuracy problems in industrial practice, making this the single largest error source. Unlike domain errors, mesh errors can be local, affecting only a poorly resolved feature, which makes them harder to catch with a simple sensitivity study.
Mistake 3: Wrong y+ Value for the Near-Wall Treatment
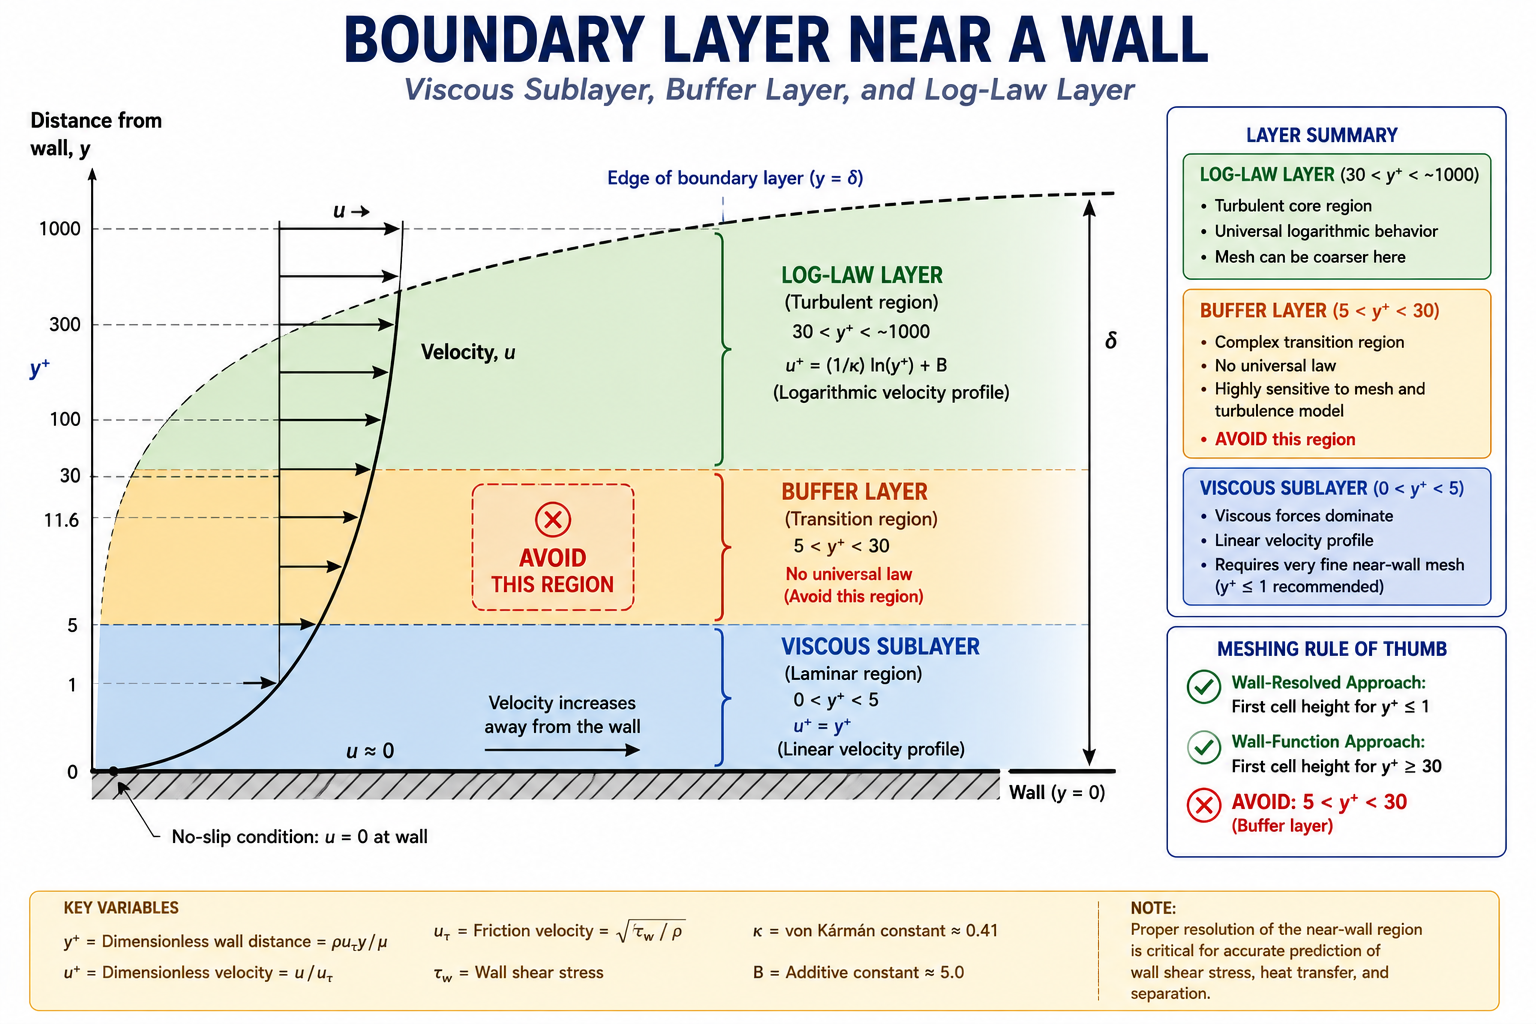
The y+ value of the first wall cell determines which part of the boundary layer that cell sits in. Below 5 is the viscous sublayer. Between 5 and 30 is the buffer layer, where neither wall functions nor low-Re models are accurate. Above 30 is the log-law layer.
Wall functions are only valid in the log-law region, typically y+ between 30 and 300. Landing in the buffer layer produces wall shear stress errors of 10 to 40 percent. Low-Reynolds-number models resolve the sublayer directly but need much finer meshes, usually 15 to 20 cells across the boundary layer with the first cell at y+ below 1.
| Near-Wall Treatment | y+ Target | What Happens if Wrong | When to Use |
|---|---|---|---|
| Low-Re (resolves boundary layer) | y+ < 1 | 1–5: transition error; > 5: wall function takes over | Skin friction drag, heat transfer, turbine cooling |
| Standard wall functions | 30 < y+ < 300 | < 30: over-predicts shear; > 300: too coarse | Attached turbulent boundary layers, cruise aero |
| Enhanced wall treatment | Any, avoid 5–30 | Buffer layer wrong for both models | General use when y+ is uncertain |
| Scalable wall functions | y+ ≥ 11.25 (enforced) | Less accurate than low-Re, but avoids divergence | Coarse meshes, ±10–15% accuracy acceptable |
Mistake 20: No Grid Convergence Study
Reporting a single-mesh result as your final answer isn’t defensible engineering practice. Every CFD solution carries discretisation error, the gap between the numerical result on a finite mesh and the true solution on an infinitely fine one. That error can range from 0.1 to 30 percent depending on flow complexity and mesh quality.
The standard method for quantifying it is the Grid Convergence Index (GCI), defined by Celik et al. in the ASME Journal of Fluids Engineering. The procedure: run three systematically refined meshes, compute the observed order of convergence, then calculate GCI as a percentage uncertainty band on the fine-mesh result. Below 3 percent is acceptable for most engineering work. Below 1 percent is the bar for certification-grade results.
Worked example:
Coarse mesh (500,000 cells):   Cd = 0.312
Medium mesh (2,000,000 cells): Cd = 0.295
Fine mesh (8,000,000 cells):   Cd = 0.289

Refinement ratio r = 4^(1/3) = 1.587
Observed order p = ln(|-0.017 / -0.006|) / ln(1.587) ≈ 2.25
Richardson extrapolated Cd ≈ 0.286
GCI (fine mesh) ≈ 1.4%

Result: Cd = 0.289 ± 1.4% (acceptable for engineering; < 3% target)
Category 3: Boundary Condition Errors
CFD boundary conditions prescribe the flow state, velocity, pressure, temperature, turbulence, at every domain boundary. The solver builds the interior solution from those values. Get the boundary wrong, and the interior solution is wrong even if the mesh and turbulence model are perfect.
| Inlet BC Type | When Correct | Common Mistake |
|---|---|---|
| Velocity inlet (uniform) | Known uniform freestream | Applied to non-uniform duct flow |
| Velocity inlet (profile) | Complex upstream history matters | Skipped when profile data is available |
| Pressure inlet | Pressure-driven flow (fans, buoyancy) | Used when mass flow is actually known |
| Mass flow inlet | Metered or fixed-delivery systems | Used at compressible high-speed inlets |
| Periodic/cyclic | Truly repeating geometry and flow | Applied without verifying periodicity |
| Turbulence intensity + length scale | Always required | Left at solver default (5%) |
Mistake 5: Wrong Inlet Turbulence Intensity
This is one of the most frequently mis-set boundary parameters, largely because analysts leave it at the solver default of 5 percent instead of matching it to the real upstream source.
- Low-turbulence wind tunnel: 0.05 to 0.3 percent
- Atmospheric boundary layer: 5 to 20 percent, matched to a log-law profile
- Industrial fan or blower discharge: 3 to 8 percent
- Fully developed pipe flow: roughly 2 to 5 percent
Using the 5 percent default in a low-turbulence wind tunnel case inflates inlet turbulence energy by a factor of 15 to 100, artificially delaying separation and skewing the stall prediction.
Mistake 6: Outlet Boundary Too Close to the Body
A pressure outlet only behaves correctly when the flow there is roughly parallel with small velocity gradients, conditions that exist well downstream of any wake or recirculation. If the outlet sits too close, the prescribed pressure propagates upstream and distorts the flow around the body.
The tell-tale sign: isobars near the outlet curve toward the boundary instead of running parallel to it. If the wake velocity deficit at the outlet exceeds 5 percent of freestream, move the outlet back. For highly separated flows, that can mean 30 to 50 body diameters downstream, further than most analysts initially expect.
Category 4: Solver Settings and Convergence
These are the most deceptive mistakes because they leave no visible trace in the output. A run with wrong under-relaxation, wrong convergence criteria, or too large a time step looks identical to a correctly configured one.
Mistake 9: Declaring Convergence From Residuals Alone
Residuals measure the global imbalance of the governing equations across every cell. Standard guidance says to run until residuals drop 3 to 4 orders of magnitude. That’s necessary, but not sufficient.
A simulation can show residuals down 6 orders of magnitude while drag is still changing by several percent every 100 iterations. This happens because a small, slowly evolving region, a separation bubble or corner vortex, can be invisible to the global residual while still driving the forces you actually care about. Monitor lift, drag, and mass flow directly. Declare convergence when those stabilize, not when residuals hit a target.
| Convergence Indicator | Adequate Value | Recommended Action if Not Met |
|---|---|---|
| Residual (continuity) | < 1×10⁻⁴ engineering; < 1×10⁻⁶ high-accuracy | Continue iterating; check mesh quality |
| Residual (momentum) | < 1×10⁻⁴ engineering; < 1×10⁻⁵ aero | Check mesh; reduce time step for transient |
| Cd stabilisation | < 0.1% change over last 200 iterations | Continue iterating; consider transient RANS |
| Cl stabilisation | < 0.1% change over last 200 iterations | Time-average or switch to unsteady |
| Mass flow imbalance | < 0.1% of inlet mass flow | Check for boundary or geometry errors |
Mistake 18: Not Checking Mass Flow Imbalance
Mass conservation is the most basic requirement of any incompressible CFD solution. Inlet mass flow should equal outlet mass flow to within 0.1 percent. A larger imbalance means the run hasn’t converged, or there’s a geometry gap or boundary condition mismatch letting mass leak through a wall.
This is the simplest, most reliable check available and should be the first thing you look at, before force, pressure, or temperature results. If mass isn’t conserved, nothing downstream is trustworthy.
Category 5: Post-Processing Errors
These mistakes happen after a correctly run simulation, in how the results get extracted, displayed, or interpreted. They’re the CFD equivalent of FEA post-processing errors.
Mistake 11: Wrong Reference Values for Force Coefficients
Cd = Drag / (0.5 × ρ × V² × A_ref). The reference area A_ref isn’t universal:
- Aircraft: wing planform area
- Automobiles: frontal projected area
- Bluff bodies: frontal projected area (diameter × length, or πd²/4 for a sphere)
- Buildings: depends on loading direction
Using the wrong reference area shifts Cd by the ratio between the correct and incorrect areas, which can be 20 to 50 percent for geometries where planform and frontal area diverge significantly. Document the reference area used before publishing any coefficient, and confirm it matches when comparing across codes or against test data.
Mistake 12: Averaged Instead of Peak Values
Contour plots often average nodal values from surrounding elements. At high-gradient locations, stagnation points, suction peaks, separation onset, that averaging can under-report the true peak by 10 to 40 percent. For surface Cp plots, always pull unaveraged, cell-centred values at critical points. The leading-edge suction peak, in particular, determines boundary layer transition and is exactly where averaging does the most damage.
The CFD Validation Workflow
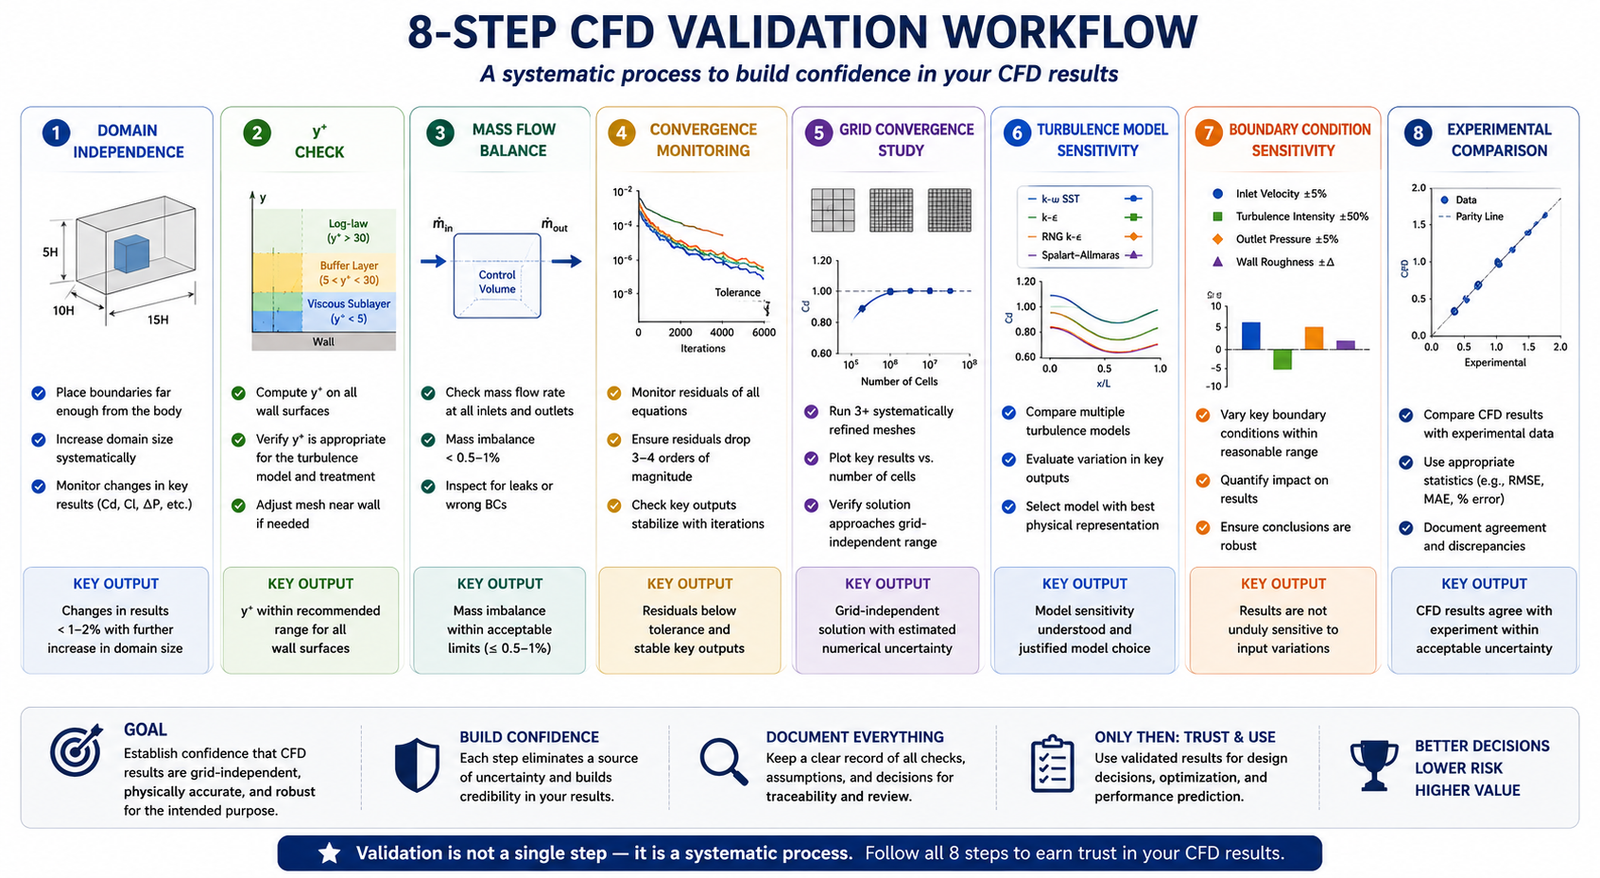
No single check catches every mistake. Domain independence doesn’t catch y+ errors. y+ checks don’t catch convergence errors. The full workflow runs every check in sequence:
- Domain independence: extend each boundary 50 percent and compare Cd, Cl, and surface Cp. Repeat until results change less than 1 percent.
- y+ check: plot y+ on all walls after the first converged run and confirm it matches your near-wall model.
- Mass flow balance: confirm imbalance is under 0.1 percent of inlet mass flow.
- Convergence by monitored quantities: track Cd, Cl, mass flow, and pressure versus iteration, not just residuals.
- Grid convergence study: run coarse, medium, and fine meshes and report GCI.
- Turbulence model sensitivity: compare two models (for example, SST versus Realizable k-ε). Agreement within 5 percent means model choice isn’t the dominant uncertainty.
- Boundary condition sensitivity: vary uncertain inlet turbulence by a factor of 3 and check the impact.
- Comparison with reference data: validate against a known analytical or experimental case before trusting the target geometry result.
What a Reportable CFD Result Must Include
A CFD result isn’t ready for an engineering decision unless it documents: domain extent and independence study, mesh count and y+ distribution with GCI, turbulence model and justification, boundary conditions with values, convergence history of monitored quantities, mass flow balance, and reference values for any force coefficients. Without this, the result can’t be peer-reviewed, reproduced, or trusted.
Worked Examples
Domain independence failure, ground vehicle aerodynamics: A team ran a 3D RANS simulation at highway speed with an 8-vehicle-length downstream domain and got Cd = 0.298. Extending to 20 lengths dropped Cd to 0.271, a 9.1 percent change. The outlet had been sitting inside the vehicle’s near-wake, pulling base pressure down and inflating drag. Had the original number been used for a compliance check against a 0.28 target, the vehicle would have failed a target it actually met.
False convergence, aerofoil near stall: A NACA 0015 simulation at 15 degrees angle of attack showed residuals down 4 orders of magnitude after 2,000 iterations, reporting Cl = 1.34. Reviewing the Cl history revealed oscillation between 1.28 and 1.41 with a 150-iteration period, meaning it had never actually converged. Switching to unsteady RANS and time-averaging over five shedding periods gave Cl = 1.31 and Cd = 0.094, 8 percent higher than the false-converged steady value.
Frequently Asked Questions
How do I know if my CFD domain is large enough? Run a domain independence study. Extend every boundary by at least 50 percent and compare drag, lift, and surface pressure. If any coefficient shifts more than 1 percent, the domain was too small. For external aerodynamics, the downstream boundary is usually the critical one: 15 to 20 body lengths for streamlined shapes, 30 to 50 for bluff bodies.
What y+ value should I target? Use y+ = 0.5 to 1.0 for low-Reynolds-number models, or 30 to 100 for standard wall functions. Avoid the 5 to 30 buffer layer regardless of which near-wall treatment you’re using.
Why are my residuals converged but my drag coefficient is still changing? Residuals measure global imbalance, not local flow features. A slowly evolving separation bubble or corner vortex can keep drifting the drag coefficient while contributing almost nothing to the global residual. Monitor drag and lift directly and declare convergence only when they stabilize.
What is the Grid Convergence Index and do I need to compute it? GCI quantifies the discretisation error in your result, how far the numerical answer sits from the theoretical infinite-mesh solution. For anything feeding a design decision, regulatory submission, or published comparison, yes, you need it. A three-mesh study costs roughly three times a single run but gives you a defensible uncertainty bound.
How do I handle backflow at my pressure outlet? Move the outlet farther downstream past the recirculation zone; this is the most reliable fix. If that’s not practical, use a backflow prevention option to prescribe flow direction at the boundary, though this only reduces the boundary effect rather than eliminating the underlying accuracy problem.
What turbulence model should I use? k-ω SST is the standard general-purpose choice for external aerodynamics. For strongly separated flows, switch to DES or LES at significantly higher computational cost. Avoid standard k-ε for external aero; it has worse near-wall behavior than SST with no real advantage.
Key Takeaways
CFD setup mistakes happen before the solver runs and produce output that looks completely valid. The 20 mistakes covered here, from an undersized domain through false convergence, account for most CFD accuracy failures in industrial practice. Each has a clear detection method and a known fix.
Build the verification workflow into your process from the first run, not as damage control after someone questions the result. Domain independence and y+ checks cost one or two extra runs. A GCI study costs about three times a single run. Convergence monitoring costs nothing beyond plotting force coefficients alongside residuals. That’s a small price for results with a documented, defensible uncertainty bound.
Leave a Reply