Geometric Dimensioning and Tolerancing (GD&T) is the engineering language that defines what a manufactured part must look like and how much it can deviate from the ideal in every geometric characteristic. It is the bridge between the designer’s intent and the manufacturer’s reality, the set of rules that determines whether a $5 component will function correctly in a $50,000 assembly. Applied correctly, GD&T maximises the tolerance available to manufacturing while ensuring assembly function. Applied incorrectly, it produces unmanufacturable specifications, uninspectable callouts, and assemblies that fail despite all individual parts being within drawing tolerance.
Yet GD&T remains one of the most consistently misapplied disciplines in mechanical engineering. Feature control frames with incomplete datum reference frames. Position tolerances applied to features whose function is actually controlled by runout. Surface profile tolerances that cannot be inspected with available measurement equipment. Tolerance stack-ups that are never calculated because the analysis is too time-consuming to perform for every assembly gap. These are not failures of engineering knowledge in principle, they are failures of systematic application, and they are exactly the failures that AI can address.
This guide covers AI-assisted GD&T and tolerance analysis workflows across the complete tolerance engineering process: from GD&T callout interpretation and review, through functional requirement-to-GD&T translation, tolerance stack-up calculation (worst-case and RSS), datum reference frame assessment, ISO fit and clearance analysis, CMM measurement plan generation, and specification compliance checking. For each workflow stage, it provides specific AI tools, LLM prompt templates, accuracy guidance, and the workflow integration that makes AI assistance a standard part of tolerance engineering practice rather than an occasional supplement.
| Standards scope: This guide covers AI-assisted GD&T and tolerance analysis to both ASME Y14.5-2018 (the American National Standard) and ISO 1101:2017 (the International Standard). The two standards share most concepts but differ in some symbol definitions, modifier applicability, and default interpretations. Always specify which standard applies when using LLMs for GD&T interpretation, the LLM will apply different rules for ASME vs ISO, and applying the wrong standard to a drawing callout can produce incorrect tolerance zone interpretations. |
The GD&T and Tolerance Engineering Workflow
Before examining AI assistance for specific GD&T activities, it is useful to understand the complete tolerance engineering workflow and where AI adds the most value within it.
| Workflow Stage | Activity | Traditional Time | AI Value Level | Primary AI Tool |
| 1. Functional requirement analysis | Identify what each feature must do in the assembly, what geometric variation would cause functional failure, and what tolerance is implied by the functional requirement | 30-90 min per feature set | High, LLMs reason from functional requirement to GD&T control selection | LLMs (Claude, ChatGPT) |
| 2. GD&T control selection | Select the appropriate GD&T control (position, runout, profile, flatness, etc.) and modifiers (MMC, LMC, tangent plane) for each functional requirement | 30-90 min per feature set | High, LLMs compare candidate controls and explain trade-offs | LLMs |
| 3. Tolerance value assignment | Assign numerical tolerance values based on functional requirement, manufacturing process capability, and tolerance budget | 1-4 hours | Medium, LLMs assist with process capability lookup and tolerance budget allocation; specialist tools required for rigorous analysis | LLMs + process capability data |
| 4. Datum reference frame definition | Define primary, secondary, and tertiary datums that constrain the part correctly for its functional assembly context | 30-60 min per DRF | High, LLMs assess DRF completeness and physical meaning | LLMs |
| 5. Tolerance stack-up analysis | Calculate the accumulated effect of tolerances on critical assembly gaps and interferences | 30 min – 4 hours per stack-up | Very High, LLMs execute worst-case and RSS calculations; specialist tools handle 3D statistical analysis | LLMs + 3DCS/CETOL/TolAnalyst |
| 6. Drawing annotation review | Verify that all GD&T callouts are complete, correctly applied, and inspectable | 30-90 min per drawing | High, LLMs review callouts systematically; drawing checkers flag annotation errors | LLMs + drawing checker tools |
| 7. CMM measurement plan | Define the CMM probing strategy for each GD&T callout: which surfaces to probe, how many points, how to establish the DRF physically | 1-3 hours per part | High, LLMs generate measurement plans from GD&T callout descriptions | LLMs |
| 8. Inspection results interpretation | Interpret CMM measurement results against GD&T callouts: has the part passed, and if not, what specifically failed? | 30-90 min per part report | Medium, LLMs interpret reported values against tolerance limits; CMM software handles primary interpretation | LLMs + CMM software |
AI for GD&T Callout Interpretation
GD&T callout interpretation, understanding precisely what a feature control frame means in terms of the three-dimensional tolerance zone it creates, the physical inspection method it implies, and the manufacturing conditions it is sensitive to, is one of the clearest and most immediately valuable AI applications in tolerance engineering. GD&T interpretation is rules-based and can be executed systematically from the feature control frame text.
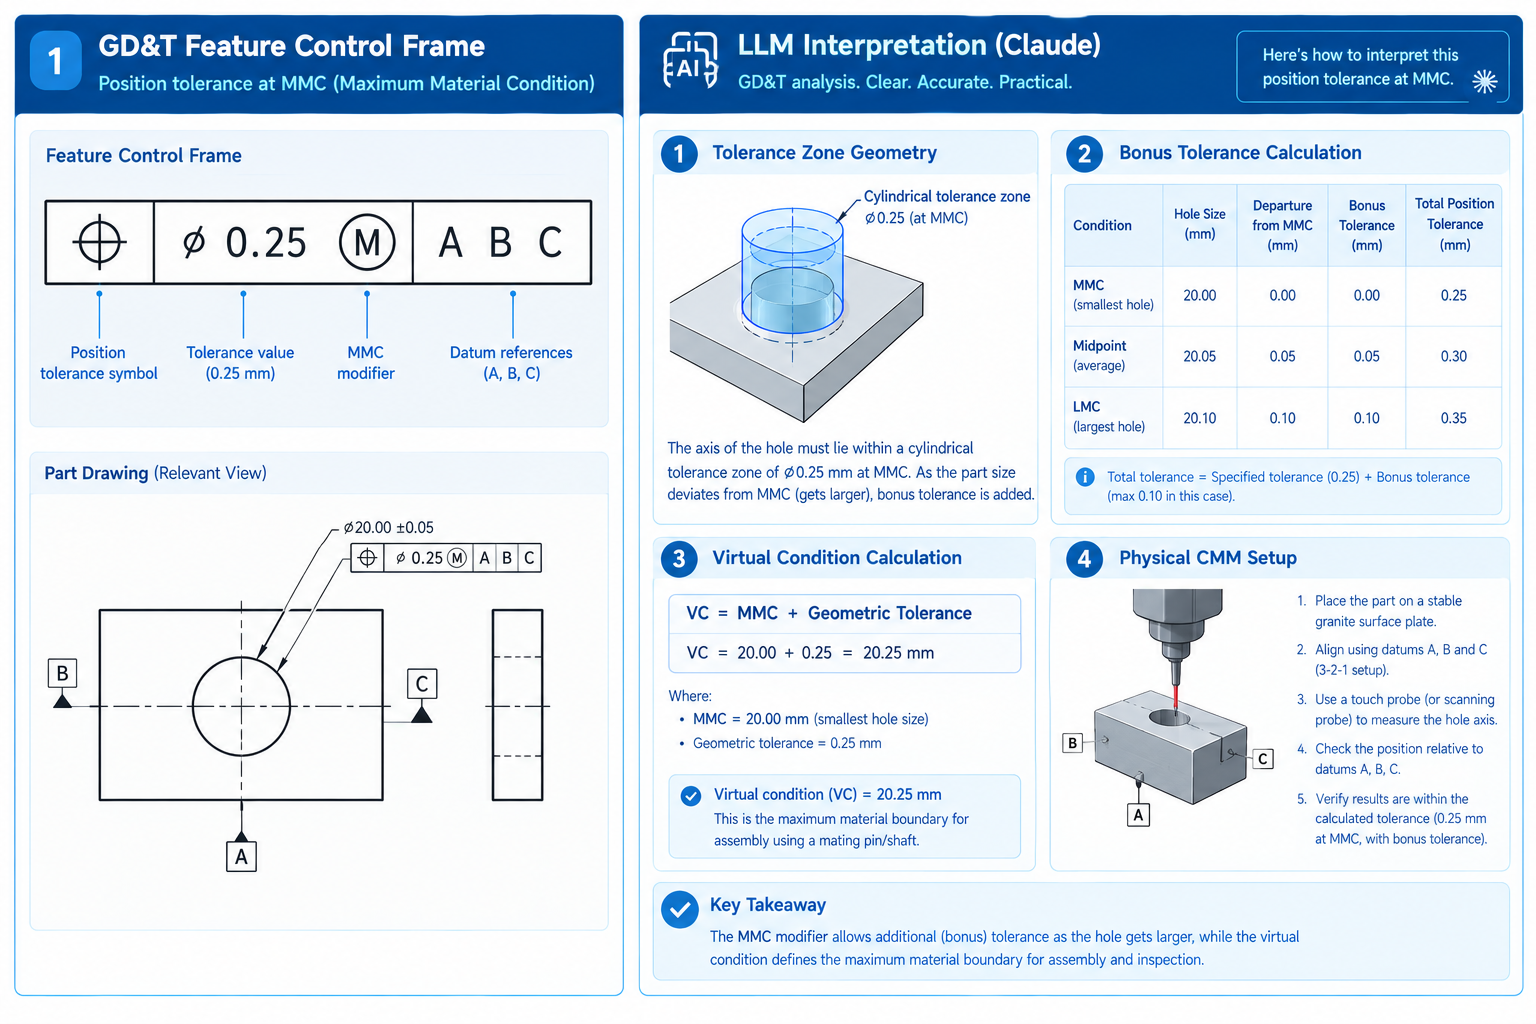
What LLMs Can Interpret in a GD&T Callout
When given a GD&T feature control frame in text form (e.g. ‘position, diameter 0.2mm at MMC, referenced to datum A primary, datum B secondary, datum C tertiary’) and the applicable standard, an LLM can accurately interpret:
- The geometric characteristic: What property of the feature is being controlled (location, form, orientation, runout, or profile).
- The tolerance zone geometry: The three-dimensional shape of the tolerance zone (cylindrical for position of a hole axis, planar band for flatness, spherical for position of a point, etc.) and its size.
- Material condition modifier effects: If MMC (Maximum Material Condition) or LMC (Least Material Condition) is specified, the LLM calculates the bonus tolerance available at the stated condition and at the opposite material condition extreme. For a 10mm hole with H7 tolerance and a position tolerance of diameter 0.2mm at MMC: the LLM calculates the bonus tolerance at LMC (10.015mm) and the total position tolerance available at LMC (0.2 + 0.015 = 0.215mm).
- Datum reference frame physical setup: How the part would be physically constrained to establish the datum reference frame for inspection, which surface sits on the granite surface plate (primary), which surface contacts the locating pins (secondary and tertiary).
- Inspection method implication: Whether the callout is most efficiently verified by functional gauge, CMM, or hand measurement, and which inspection approach is most sensitive to the functional requirement.
- Virtual condition: The worst-case boundary that must be satisfied for part functionality, relevant for mating part analysis and functional gauge design.
| GD&T Callout Type | LLM Interpretation Accuracy | Key Interpretation Output | Where to Verify |
| Position (diametric tolerance zone, MMC/LMC modifier) | High, well-defined rules for bonus tolerance calculation, virtual condition, and DRF setup | Tolerance zone geometry, bonus tolerance table, virtual condition, functional gauge concept | Cross-check bonus tolerance calculation against ASME Y14.5-2018 Rule 2 for specified modifier |
| Profile of a surface (bilateral/unilateral) | High for standard bilateral; moderate for unilateral and non-uniform profiles | Tolerance band geometry, whether datum-related or not, how deviation is measured | Verify unilateral and non-uniform profile interpretation against ASME Y14.5-2018 Section 8 |
| Composite position (two-tier feature control frame) | Moderate, the pattern-locating tolerance (PLTZF) vs feature-relating tolerance (FRTZF) distinction is nuanced | PLTZF vs FRTZF explanation, what each tier controls, how both must be satisfied simultaneously | Carefully verify composite position interpretation; this is one of the most frequently misunderstood callouts |
| Runout (circular and total) | High, well-defined rules; distinction between circular and total runout is clear | What is measured at each cross-section (circular) vs full surface (total), datum axis establishment | Verify physical inspection setup requirements for non-trivial datum axis configurations |
| Concentricity and symmetry (ISO only) | High, rarely used in ASME (concentricity removed in Y14.5-2018); well-defined in ISO 1101 | Median point or median plane tolerance zone; distinction from position tolerance | Note: ASME Y14.5-2018 removed concentricity; verify applicability to the standard being used |
| Flatness (form control, no datum) | Very high, simple, well-defined tolerance zone; no datum dependency | Parallel plane tolerance zone; no datum reference; how it differs from parallelism | Straightforward; LLM interpretation highly reliable for standard applications |
| Perpendicularity / angularity / parallelism | High, well-defined orientation tolerance zones | Planar, cylindrical, or linear tolerance zone geometry depending on feature type; DRF required | Verify that the correct tolerance zone geometry (planar vs cylindrical) is applied for the feature type |
| ASME vs ISO: Always Specify the Standard The most common LLM GD&T interpretation error occurs when the applicable standard is not specified in the prompt. ASME Y14.5-2018 and ISO 1101:2017 differ in several important ways: ISO does not use the same material condition modifier symbols as ASME; ISO 1101 uses ‘E’ (Envelope requirement) rather than Rule 1; ISO 2768 defines general tolerances differently from ASME; and concentricity was removed from ASME Y14.5-2018 but remains in ISO 1101. Always include the standard in every GD&T prompt. The templates in the LLM Prompt Templates section all include standard specification as a mandatory prompt element. |
AI for Functional Requirement to GD&T Translation
The most common GD&T error in engineering practice is applying a GD&T control that looks appropriate without first establishing what the functional requirement actually is. Position tolerance looks correct for a hole that must mate with a pin, but if the functional requirement is that the hole axis must be concentric with an external surface (for a rotating component), runout is the correct control, not position. Applying position to a functional requirement that runout addresses correctly produces either an over-constrained specification (position is tighter than runout would need to be) or an under-constrained one (position allows movement that runout prevents).
The Functional Requirement to GD&T Translation Framework
The correct sequence for GD&T specification is: (1) Define the functional requirement, what must this feature achieve in the assembly? (2) Identify the geometric characteristic that controls this function. (3) Select the GD&T control that most directly captures this characteristic. (4) Define the datum reference frame that correctly constrains the part for this function. (5) Assign the tolerance value from process capability and functional analysis. LLMs can assist with steps 1-4; step 5 requires process capability data.
| Functional Requirement | Geometric Characteristic | Correct GD&T Control | Common Mistake | LLM Guidance |
| Hole axis must be located relative to datum surfaces for a bolted joint | Location of hole axis in 3D space | True position (diametric tolerance zone, usually at MMC) | Using +/- coordinate tolerances instead of position, wasteful of tolerance and less functional | LLM explains why position > coordinate tolerances for bolted joint holes; calculates equivalent position tolerance from coordinate tolerance |
| Bearing bore must run true with the shaft axis to minimise vibration | Coaxiality of bore axis with datum axis during rotation | Total runout (to control axis-plus-form error in rotation) or circular runout (axis only) | Using position or concentricity, position allows static offset; concentricity is difficult to inspect; runout is the correct control for rotating features | LLM distinguishes circular vs total runout and explains which is appropriate for the vibration control requirement |
| Sealing face must be flat for O-ring compression uniformity | Form of the surface (flatness) | Flatness (form control; no datum) | Adding a datum to a flatness callout (making it parallelism, not flatness), unnecessary if only surface form matters | LLM distinguishes flatness (form only) from parallelism (orientation to datum) and advises which is appropriate for each sealing face type |
| Slot width must be centred on the part for a symmetric loading condition | Symmetry of slot walls about the datum centre plane | Profile of a surface (bilateral, referenced to symmetric datum axis), or position with centre plane tolerance zone | Using symmetry (ISO) or concentricity (old ASME), symmetry is difficult to inspect; profile of a surface is more functional and inspectable | LLM recommends profile of a surface over symmetry for symmetric feature location and explains the inspection advantage |
| Mating shaft must fit through a bore with defined clearance at assembly | Location and size combined (virtual condition analysis needed) | Position at MMC for location; ISO 286 fit class for size | Specifying size tolerance only without position tolerance, allows correct size but incorrectly located feature that won’t assemble | LLM combines position at MMC and ISO fit analysis to determine whether the assembly is guaranteed to fit at all material condition combinations |
| Two holes must be coaxial for a pin to pass through both simultaneously | Coaxiality of the two hole axes | Position (both holes referenced to a common datum axis) or coaxiality (ISO 1101) | Specifying each hole’s position independently to different datums, does not control the relative position of the two holes to each other | LLM identifies that both holes must share a common datum reference to control their relative coaxiality; recommends datum scheme |
AI for Tolerance Stack-Up Analysis (Worst-Case and RSS)
Tolerance stack-up analysis is the calculation that determines whether the accumulated effect of all tolerances in an assembly chain produces a critical gap or interference that is within acceptable limits. It is one of the most important and most frequently skipped tolerance engineering activities, skipped because it is time-consuming to set up correctly, and its absence is invisible until assembly problems reveal it. LLMs can perform both worst-case and RSS stack-up calculations with high reliability, making this analysis accessible for every critical assembly gap rather than only the ones where a specialist tolerance analyst is available.
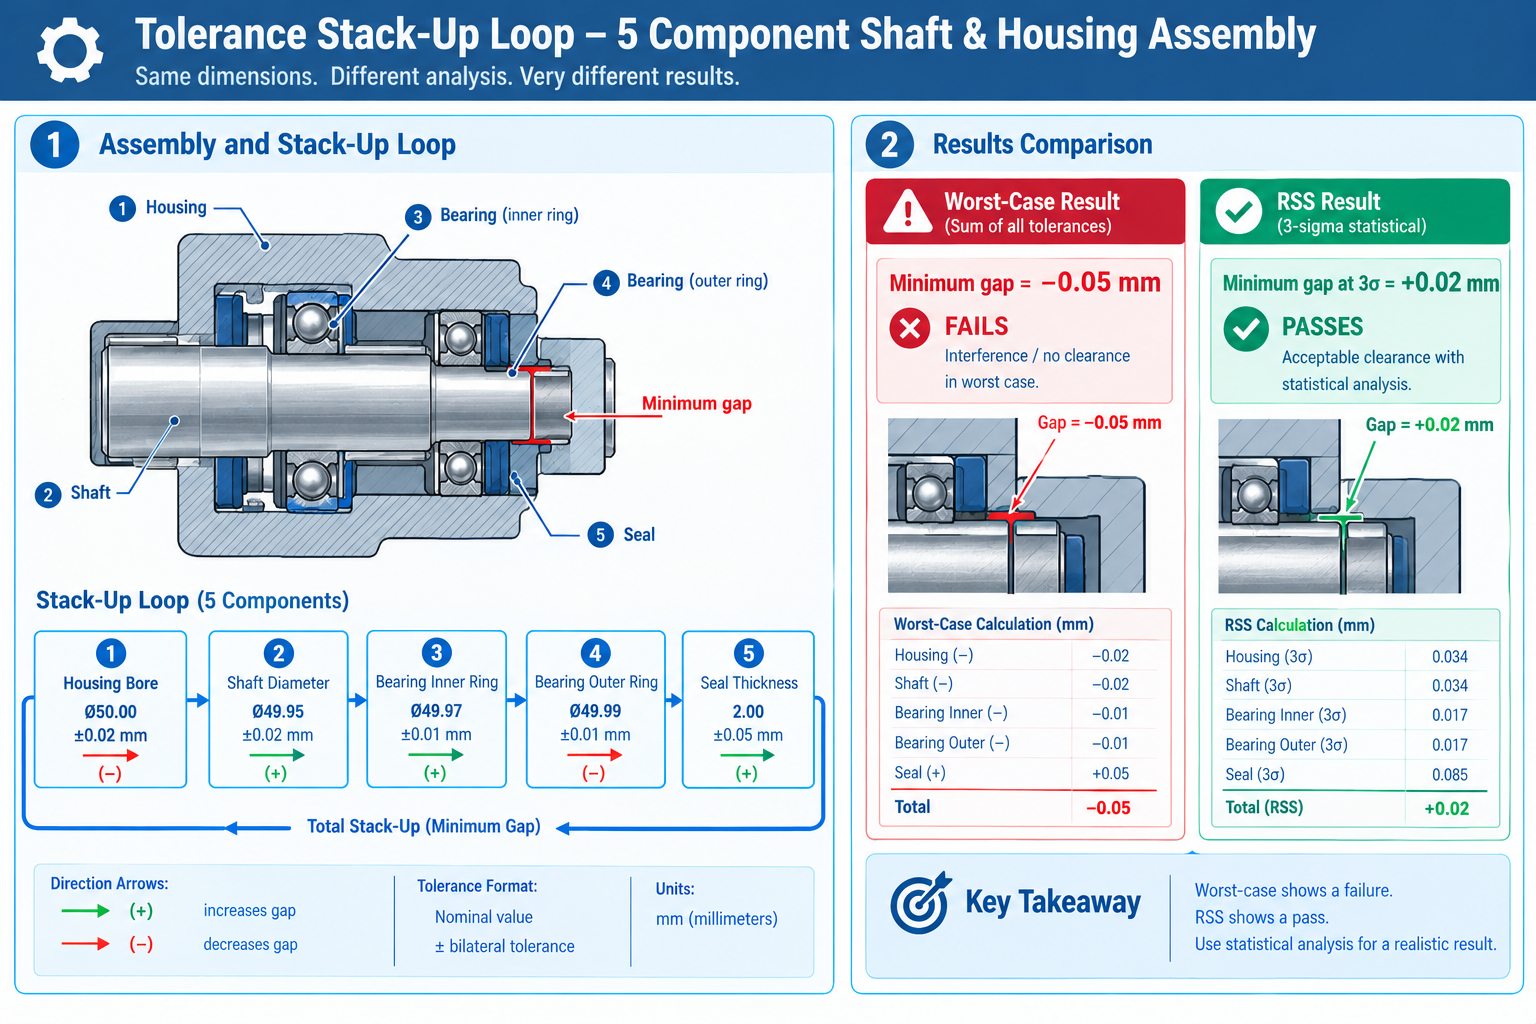
Worst-Case (Arithmetic) Tolerance Stack-Up
Worst-case stack-up analysis determines the minimum and maximum possible gap when every tolerance is simultaneously at its worst extreme. This is the most conservative approach, it guarantees the assembly will always work regardless of the combination of manufactured tolerances, but it requires the tightest individual tolerances to guarantee assembly at all material conditions.
The method:
- Identify the critical gap or interference (what must be checked)
- Define the acceptance criterion (minimum positive gap, or gap within specified limits)
- Identify every dimension in the stack-up loop that contributes to the gap (in the correct direction of contribution)
- For each dimension: state the nominal value and the bilateral tolerance
- Calculate mean gap = sum of (nominal x direction)
- Calculate total variation = sum of all bilateral tolerances
- Minimum gap = mean gap – total variation; Maximum gap = mean gap + total variation
- Compare minimum gap to acceptance criterion
LLMs execute this calculation reliably from described inputs. The prompt structure: ‘Perform a worst-case tolerance stack-up analysis. Critical gap: [DESCRIBE]. Acceptance criterion: [MINIMUM POSITIVE GAP / MUST BE IN RANGE x to y mm]. Dimensions in the loop: [LIST EACH: nominal value, bilateral tolerance, direction (+/-)].’ The LLM shows each step with units and identifies the dominant tolerance.
RSS (Root Sum Square) Statistical Tolerance Analysis
RSS analysis applies statistical principles to tolerance accumulation. Instead of assuming every tolerance is simultaneously at its worst extreme (which is statistically unlikely for independent dimensions), RSS calculates the combined variation as the root of the sum of the squares of the individual tolerances, analogous to adding independent probability distributions in quadrature.
The statistical meaning: if all tolerances are 3-sigma limits (Cp = 1.0) with normal distributions, the RSS-combined variation is also a 3-sigma limit. At 3 sigma, 99.73% of assemblies will be within the RSS-calculated range. At 6 sigma (if all individual tolerances are 6-sigma limits), the combined variation represents a 6-sigma combined limit.
LLM RSS calculation prompt: ‘Perform an RSS tolerance stack-up analysis. Assume all tolerances are 3-sigma limits (Cp = 1.0, normal distribution). Dimensions: [LIST]. Provide: (1) Mean gap. (2) RSS combined variation (square root of sum of squares of individual tolerances). (3) Minimum gap at 3-sigma (99.73% yield). (4) Minimum gap at 6-sigma. (5) Statistical yield if minimum gap = 0. (6) Dominant tolerance (largest single contributor to RSS). (7) Compare worst-case vs RSS minimum gap and recommend which approach is more appropriate for [PRODUCTION VOLUME AND CRITICALITY].’
| Analysis Method | Mathematical Basis | When to Use | Required Inputs | LLM Capability |
| Worst-case (arithmetic) | Total variation = sum of all bilateral tolerances | Low-volume production; safety-critical assembly; guaranteed 100% assembly yield required | Nominals, bilateral tolerances, directions for each dimension in the loop | Very high, straightforward arithmetic calculation with clear rules |
| RSS (Root Sum Square) | Total variation = sqrt(sum of squares of individual tolerances); assumes independent normal distributions | High-volume production where statistical yield (99.73%+) is acceptable; cost of tight individual tolerances outweighs occasional assembly fallout | Same as worst-case + assumption of Cp (typically 1.0 for 3-sigma limits) | Very high, well-defined calculation with clear statistical interpretation |
| Monte Carlo simulation | Random sampling across each tolerance distribution; simulates millions of assemblies to build gap distribution | When non-normal distributions apply; when correlations between dimensions exist; for probabilistic risk assessment beyond RSS | Full probability distributions for each dimension (not just tolerance limits) | Low, LLMs can set up the simulation concept but cannot run the random sampling; requires specialist software (3DCS, CETOL, Crystal Ball) |
| 3D statistical (geometric variation) | Extends RSS to 3D geometric variation: tolerances in x, y, z and rotational degrees of freedom; accounts for datum reference frame variation | Complex 3D assemblies where 1D stack-up does not capture the geometry correctly | Full 3D CAD model + all GD&T callouts and tolerances | Low, requires specialist software (3DCS Variation Analyst, CETOL 6 Sigma, Sigmetrix); LLM cannot perform 3D geometric variation analysis |
AI for 3D Statistical Tolerance Analysis
One-dimensional tolerance stack-up (which LLMs perform reliably) captures the variation in a single direction, the axial gap in a shaft and housing assembly, the linear clearance in a bolted joint pattern. It does not capture the three-dimensional variation that occurs in complex assemblies where tolerances in multiple directions interact to produce a combined effect on a critical characteristic that is not aligned with any single coordinate axis.
3D statistical tolerance analysis, implemented in specialist tools including 3DCS Variation Analyst (Dimensional Control Systems), CETOL 6 Sigma (Sigmetrix), and Siemens Variation Analysis, models the full 3D assembly geometry, applies the GD&T callouts from the drawing to each component, simulates the variation in six degrees of freedom for each tolerance, and calculates the statistical variation of the critical characteristic (which may be an angle, a clearance in a specific direction, a contact force, or a gap measured along a complex curve).
What AI Does in 3D Tolerance Analysis Tools
AI in specialist 3D tolerance tools accelerates the most time-consuming parts of the setup workflow:
- Automatic GD&T recognition from CAD models: AI reads GD&T callouts from 3D annotations (PMI/MBD) embedded in the CAD model and automatically populates the tolerance contributors in the analysis model, reducing the manual entry step that currently consumes 50-70% of 3D tolerance analysis setup time.
- Sensitivity analysis: AI identifies which tolerances contribute most to the variation of the critical characteristic (the ‘dominant contributors’) and recommends which tolerances should be tightened to most efficiently reduce the combined variation. This replaces the manual sensitivity study that requires re-running the simulation for each parameter change.
- Monte Carlo simulation for non-normal distributions: AI-assisted Monte Carlo sampling in 3DCS and CETOL simulates millions of assemblies in minutes to build the gap distribution, providing not just the mean and standard deviation but the full shape of the distribution including tail behaviour that is critical for low-probability but high-consequence assembly failures.
- Design optimisation: AI optimisation modules in 3DCS and CETOL search the tolerance design space to find the combination of individual tolerances that achieves a target statistical yield at minimum cost, balancing the cost of tightening high-contribution tolerances against the benefit of improved yield.
| When to Escalate from LLM Stack-Up to 3D Specialist Tools: Use 3D specialist tools (3DCS, CETOL) when: (1) the critical characteristic is not aligned with a single coordinate axis (a clearance measured at an angle, a gap at the end of a lever arm); (2) the assembly has more than 5-6 components with complex 3D relationships; (3) the tolerance contributors include profile of a surface (which creates variation in multiple directions simultaneously); (4) the production volume is high enough that statistical tail behaviour (3-sigma vs 6-sigma) has significant economic implications; (5) the product is regulated and the tolerance analysis must be traceable and formally documented. Use LLMs for: 1D and 2D linear stack-ups; sensitivity assessments for which tolerance to prioritise; ISO fit analysis; and GD&T concept guidance. |
AI for Datum Reference Frame Assessment
The datum reference frame (DRF) is the foundation of every GD&T callout that references a datum, it defines the coordinate system relative to which the tolerance zone is located, oriented, and measured. An incorrect or incomplete DRF is one of the most consequential GD&T errors because it affects every callout that references that datum: the tolerance zone is in the wrong location or orientation, and the part can simultaneously be within drawing tolerance and functionally non-conforming.
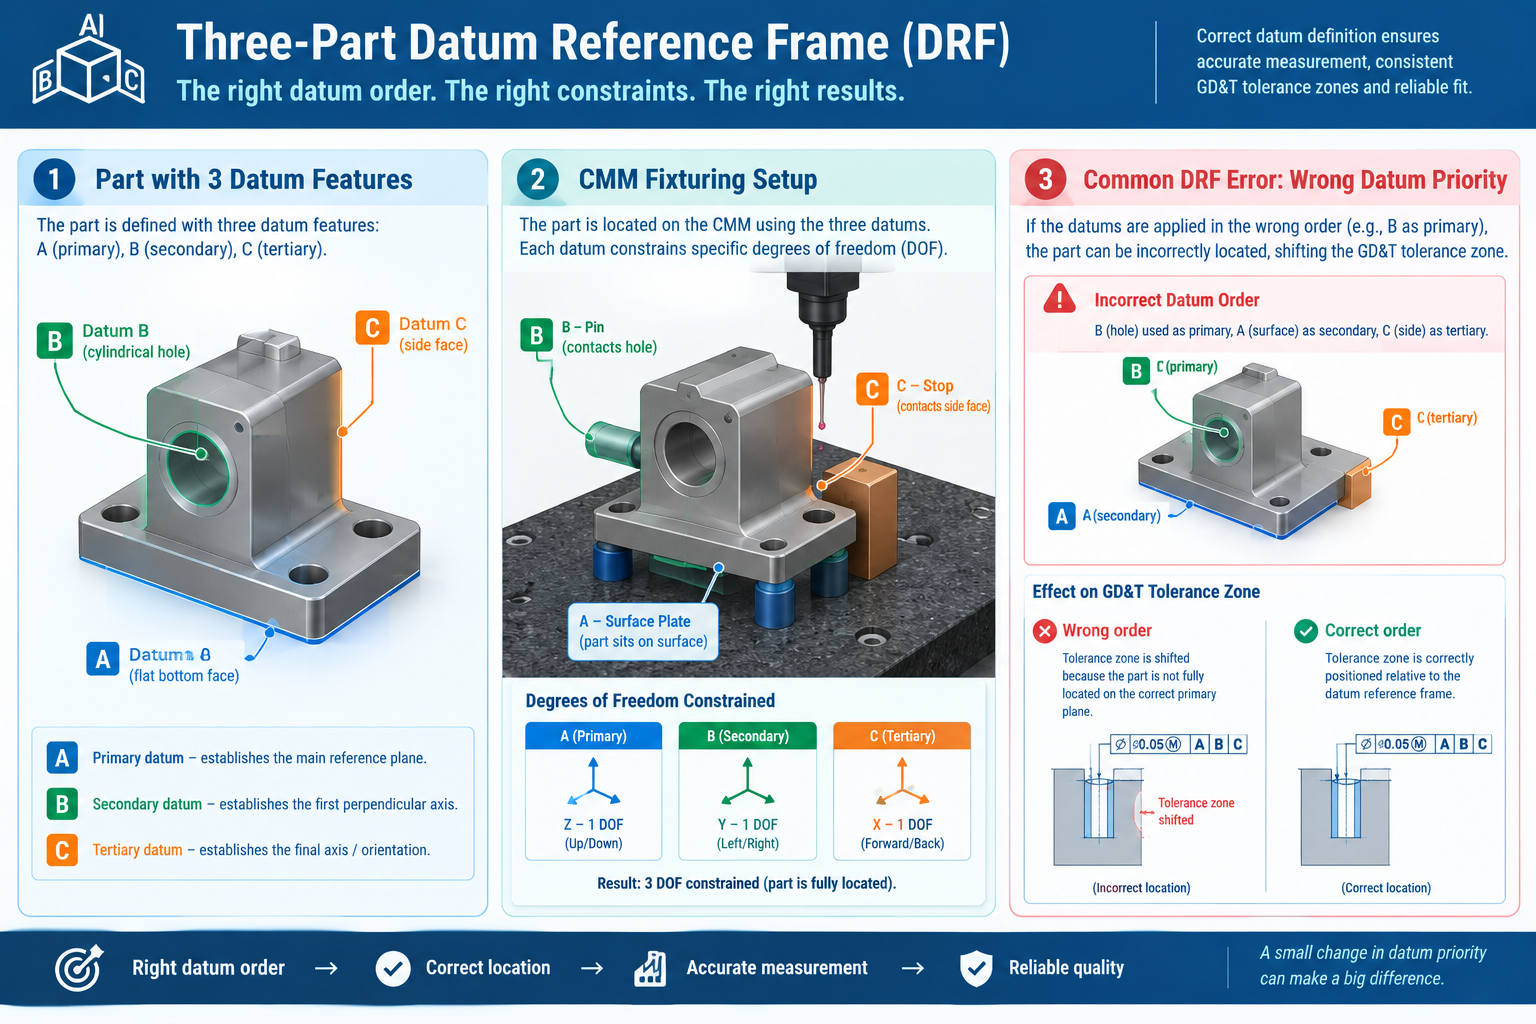
The Three Degrees of Constraint and Their Physical Meaning
A complete DRF constrains the six degrees of freedom of a rigid body (three translational, three rotational) using a primary, secondary, and tertiary datum combination. The number of degrees of freedom constrained by each datum depends on the datum feature type:
| Datum Feature Type | Degrees of Freedom Constrained | How Established Physically | GD&T Requirement |
| Planar surface (primary) | 3 (one translation + two rotations about axes in the plane) | Part rests on a flat datum simulator (e.g. granite surface plate); the surface contacts the simulator at the 3 highest points | Fully constrains one translation and two rotations, removes all out-of-plane variation |
| Cylindrical surface (primary) | 4 (two translations + two rotations) | Part is located in a cylindrical datum simulator (e.g. chuck, collet, precision bore) | Removes all radial variation from the datum axis, useful for rotationally symmetric parts |
| Planar surface (secondary) | 1 (one rotation about the axis perpendicular to primary plane) | Part is pushed against a side datum surface (contacts at 2 points) while seated on primary datum | Removes the remaining in-plane rotation, requires the surface to contact at 2 minimum points |
| Hole / pin (secondary) | 2 (two translations in the datum plane) | Precision pin enters the datum hole; locates the part in the datum plane | Removes lateral translation, the pin-in-hole secondary datum is the most common in precision machined parts |
| Flat face (tertiary) | 1 (one translation along datum plane normal) | Part contacts the tertiary datum at 1 point while primary and secondary are established | Removes the remaining translational degree of freedom |
| Hole / pin (tertiary) | 1 (one rotation about the secondary datum feature) | Precision pin enters the tertiary datum hole; prevents rotation about the secondary | Elongated pin (slot) used for tertiary hole to avoid over-constraint with secondary pin |
AI Assessment of DRF Completeness and Correctness
LLMs assess DRF completeness and correctness when given a description of the datum sequence and the part’s functional assembly context. The prompt: ‘Assess the following datum reference frame for the described part and its functional requirements. Part: [DESCRIBE]. Assembly context: [HOW DOES THIS PART LOCATE IN THE ASSEMBLY?]. DRF: Datum A = [DESCRIBE FEATURE TYPE AND LOCATION]. Datum B = [DESCRIBE]. Datum C = [DESCRIBE]. Questions: (1) How many degrees of freedom does each datum constrain? (2) Are all six degrees of freedom constrained? Are any over-constrained?
(3) Does the DRF represent the assembly location correctly, does the sequence of datums match the assembly contact sequence? (4) Is the DRF physically realisable for CMM inspection, can the part be fixtured in this DRF without ambiguity? (5) Are there any alternative datum choices that would better represent the functional assembly context?’
The most valuable LLM DRF assessment is the comparison of the drawing DRF against the physical assembly context. A common error: a part is functionally located in the assembly by its bore (primary) and one flat face (secondary), but the drawing DRF uses the flat face as primary and the bore as secondary. The GD&T callouts are therefore specified relative to the wrong datum priority, tolerances that are looser in the drawing’s DRF sequence may be tighter in the assembly’s functional loading sequence.
AI for ISO Fit and Clearance Analysis
ISO 286 shaft-and-hole fits are the standardised system for specifying mating features that must assemble, slide, or be pressed together. Selecting the correct fit for a given assembly function, and verifying that the selected fit achieves its intended clearance or interference across the full operating temperature range, is a tolerance analysis activity where LLMs add significant value.
AI for ISO Fit Selection
LLMs can select appropriate ISO 286 fits from a described assembly function:
| Assembly Function | Recommended Fit | Clearance/Interference at Nominal | LLM Analysis Output |
| Sliding fit: shaft rotates or slides in bore; easy assembly and disassembly required | H7/f7 or H7/g6 | Clearance: H7/g6 at 25mm = 0.007-0.041mm clearance | Clearance range at nominal; minimum clearance (at MMC/LMC combination); assembly force estimate; recommended lubricant film thickness for the clearance |
| Location clearance: accurate location with some movement for adjustment; easy assembly | H7/h6 or H7/js6 | Near-zero clearance: H7/h6 at 25mm = 0 to 0.034mm clearance (never interference) | Whether parts will always assemble by hand; whether zero clearance cases need design provision; position tolerance remaining after fit |
| Transition fit: good location; may have slight clearance or interference; moderate assembly force | H7/k6 or H7/m6 | H7/k6 at 25mm = 0.018mm interference to 0.016mm clearance | Probability of clearance vs interference for each part; assembly force range; whether press or mallet is required |
| Light interference fit: permanent location; disassembly possible with effort; moderate press force | H7/p6 or H7/r6 | H7/p6 at 25mm = 0.009-0.043mm interference | Press force estimate; whether the interference stress exceeds the bore material’s yield stress (Lame’s equations) |
| Heavy press fit: permanent location; not intended for disassembly; significant torque/force transmission | H7/s6 or H7/u6 | H7/s6 at 25mm = 0.023-0.059mm interference | Press force; whether heating/cooling is required for assembly; interference stress; fatigue risk from the interference stress concentration |
AI for Thermal Expansion Analysis of ISO Fits
The most frequently missed tolerance analysis for ISO fits is the thermal expansion check: does the fit remain in the intended category (clearance, transition, or interference) across the full operating temperature range? A shaft-and-bore assembly that is a sliding clearance fit at room temperature may become an interference fit at cold soak if the bore material (aluminium) contracts faster than the shaft material (steel).
LLMs perform this analysis reliably from described inputs: ‘Shaft material: [MATERIAL], CTE = [VALUE] x10-6/K. Bore material: [MATERIAL], CTE = [VALUE] x10-6/K. Nominal diameter: [VALUE]mm. ISO fit: [DESIGNATION]. Temperature range: [MIN]C to [MAX]C. Installation temperature: 20C. (1) Calculate the change in shaft diameter and bore diameter at each temperature extreme. (2) Calculate the total diametral clearance or interference at each temperature extreme. (3) Determine whether the fit remains in the intended category (clearance/transition/interference) across the full temperature range. (4) If the fit changes category at any temperature, state at what temperature the transition occurs and recommend whether a different fit designation should be used.’
AI for GD&T Drawing Review and Completeness Checking
GD&T drawing review, verifying that every GD&T callout on a drawing is complete, correctly applied, and inspectable, is one of the most time-consuming and inconsistently performed quality checks in engineering drawing practice. AI accelerates this review through two mechanisms: automated drawing checkers that flag structural errors in GD&T annotations, and LLMs that reason about completeness and functional adequacy from a description of the drawing.
Automated GD&T Drawing Checking
SolidWorks Drawing Checker, CATIA Interactive Drafting Rules, and NX Check-Mate check engineering drawings for structural GD&T errors automatically:
- Feature control frames with missing compartments: A GD&T feature control frame missing the tolerance value, the geometric characteristic symbol, or a required datum reference.
- Datum references applied to form controls: Flatness, straightness, circularity, and cylindricity are form controls that must not reference datums; automated checkers flag this error.
- Missing tolerance value: A feature control frame drawn without a numerical tolerance value.
- Modifiers applied to inapplicable controls: MMC and LMC modifiers apply to features of size only; applying them to form or orientation controls is an error that automated checkers can detect.
- General tolerance note missing: Drawing has specific GD&T callouts but no general tolerance standard referenced in the title block.
LLM-Based GD&T Completeness Review
Beyond structural errors, LLMs assess whether the GD&T on a drawing adequately controls the part’s functional requirements, a judgment that automated checkers cannot make because they do not understand function. The LLM reviews the described drawing and asks: are there functional surfaces without GD&T callouts? Are the specified controls the most appropriate for the stated function? Are there controls that are unnecessarily tight (driving manufacturing cost with no functional benefit)? Are there callouts that appear correct but will be impossible to inspect with standard equipment?
AI for CMM Measurement Plan Generation
CMM (Coordinate Measuring Machine) measurement planning, defining how each GD&T callout on a drawing will be physically measured, how many probe points are required for each feature, in what sequence measurements should be taken, and how the datum reference frame will be established on the CMM, is a technical activity that typically requires both GD&T knowledge and CMM programming experience. LLMs can generate first-draft CMM measurement plans from GD&T callout descriptions, reducing the planning time significantly and ensuring systematic coverage of all callouts.
CMM Measurement Planning Principles AI Applies
A CMM measurement plan must address:
- DRF establishment sequence: Which features to probe first to establish the primary, secondary, and tertiary datums. The datum establishment sequence must mirror the drawing’s DRF sequence. Probe the primary datum first (typically the most planar and largest datum surface), then the secondary, then the tertiary.
- Minimum probe points per feature type: A plane requires minimum 3 non-collinear points; a cylinder requires minimum 4 points in 2 planes perpendicular to the axis (6 for a tight tolerance bore); a cone requires minimum 6 points; a sphere requires minimum 4 points. AI specifies the minimum required plus the recommended number for the tolerance tightness.
- Sampling strategy: For form control (flatness, straightness), points should be distributed across the full feature to capture the worst-case form deviation, not clustered in one region. For location control (position, runout), points should be sufficient to accurately determine the feature axis or centre point.
- Probe approach direction: The probe must approach each surface along the surface normal direction to avoid cosine error. For angled surfaces and internal features, the approach direction must be specified to avoid CMM arm collision.
- Measurement sequence efficiency: Probe path should minimise CMM travel distance while maintaining the correct establishment sequence. Features on the same face should be measured in sequence before rotating the part or reindexing.
| GD&T Control | Minimum Probe Points | Recommended Points (Tight Tolerance) | DRF Required | AI CMM Plan Output |
| Flatness (single surface) | 3 (non-collinear) | 9-25 (grid pattern across surface) | No | Grid pattern recommendation; identifies high-risk warpage zones for additional points |
| True position (hole axis) | 4 (in 2 cross-sections perpendicular to axis) | 8+ (4 per cross-section x 2 depths) | Yes, establish DRF first | DRF setup sequence; number of cross-sections based on hole depth and position tolerance |
| Perpendicularity (cylindrical feature) | 4-6 (cylinder) + 3+ (datum plane) | 8+ (cylinder) | Yes | Datum plane establishment first; cylinder probing at multiple depths; vector calculation for perpendicularity deviation |
| Runout (surface to datum axis) | 4 per circular cross-section (circular); 16+ full surface (total) | 8 per cross-section (circular); 25+ (total) | Yes, datum axis from cylindrical datum features | Datum axis establishment (cylindrical bore probing); multiple cross-sections for total runout |
| Profile of a surface | Depends on complexity; minimum 6 for simple profiles | 25-100+ for complex 3D surface profiles | Yes (if datum-referenced) | Sampling points matched to surface complexity; AI recommends maximum deviation locations based on surface curvature |
| Cylindricity (form control) | 12 minimum (3 cross-sections x 4 points) | 24+ (6 cross-sections x 4+ points) | No | Even cross-section distribution along bore length; additional points near ends where form error is typically highest |
AI for Tolerance Specification Compliance
Tolerance specification compliance checking, verifying that a part’s measured values, as reported by the CMM, satisfy the drawing GD&T callouts, is the final step in the tolerance engineering workflow. LLMs can assist with interpreting CMM reports against GD&T callouts, particularly for callouts with material condition modifiers where the compliance assessment requires a calculation beyond a simple comparison of measured value against tolerance limit.
AI for MMC/LMC Bonus Tolerance Compliance Calculation
When a position tolerance is specified at MMC, the actual tolerance available for a specific manufactured part depends on how far that part’s feature of size departs from MMC. The larger the departure from MMC (the more material is removed from a hole, or added to a shaft), the more bonus tolerance is available. CMM software calculates this automatically, but LLMs can explain and verify the calculation:
Example: A 10mm hole with H7 tolerance (10.000 to 10.015mm) has a position tolerance of diameter 0.2mm at MMC. The MMC of the hole is 10.000mm (smallest hole = most material). If the manufactured hole is 10.010mm (6mm from LMC, 10mm from MMC), the departure from MMC is 0.010mm, providing 0.010mm of bonus tolerance. Total allowed position deviation = 0.200 + 0.010 = 0.210mm diameter. LLM prompt: ‘Calculate the total position tolerance available for the following part: [DESCRIBE CALLOUT AND MANUFACTURED SIZE].’ The LLM calculates departure from MMC, bonus tolerance, total allowed deviation, and states whether the measured position deviation (from CMM) is within the total allowed tolerance.
AI GD&T and Tolerance Analysis Tools: Selection Guide
| Tool | Type | Capability | Integration | Pricing | Best For |
| 3DCS Variation Analyst (DCS) | 3D statistical tolerance analysis | Full 3D assembly variation; Monte Carlo; sensitivity analysis; GD&T-aware; design optimisation | SolidWorks, CATIA, NX, Creo, ProE, native CAD plugins | $20,000-$50,000/year | Automotive and aerospace programmes with complex 3D assembly variation requirements; formal tolerance analysis documentation |
| CETOL 6 Sigma (Sigmetrix) | 3D statistical tolerance analysis | Full 3D assembly variation; sensitivity analysis; 6-sigma optimisation; GD&T-aware | SolidWorks, CATIA, NX, Creo plugins | $15,000-$40,000/year | Programmes targeting 6-sigma quality levels; medical and automotive applications where formal statistical tolerance reports are required |
| SolidWorks TolAnalyst | 1D tolerance stack-up (integrated) | Linear stack-up analysis from assembly mates; worst-case and RSS; sensitivity analysis | Native SolidWorks, included in SolidWorks Professional and Premium | Included in SolidWorks Professional/Premium subscription | SolidWorks teams needing quick 1D stack-up analysis without additional software; good for simple assemblies |
| Inventor Tolerance Analysis | 1D tolerance stack-up (integrated) | Linear stack-up from assembly constraints; worst-case and RSS | Native Autodesk Inventor | Included in Inventor subscription | Inventor teams needing basic integrated stack-up analysis |
| Excel (manual formulas) | Manual spreadsheet | Worst-case and RSS, user defines formulas; flexible but error-prone; no GD&T awareness | None, standalone | Free | Teams without specialist tools for simple stack-ups; high risk of formula error without QA review |
| LLMs (Claude, ChatGPT) | AI reasoning tool | 1D and 2D worst-case and RSS calculation; GD&T interpretation; DRF assessment; ISO fit analysis; CMM measurement plan; specification compliance (including MMC bonus tolerance); thermal expansion analysis | Via conversation, no CAD integration | Free to $20-$200/month | All GD&T reasoning, interpretation, and 1D/2D tolerance analysis; most valuable for teams without specialist tools and for GD&T interpretation at all levels |
| Sigmetrix EZtol (simple) | Simple stack-up tool | 1D/2D stack-up; easier setup than CETOL; good starting point for organisations new to formal tolerance analysis | SolidWorks plugin | $3,000-$8,000/year | Organisations transitioning from Excel to formal tolerance analysis; simpler stack-ups |
| GD&T Advisor (Sigmetrix) | GD&T review tool | Reviews GD&T callouts for standard compliance, completeness, and common errors; integrated with SolidWorks | SolidWorks plugin | $3,000-$8,000/year | SolidWorks teams performing drawing QA and GD&T review; identifies structural GD&T errors before release |
LLM Prompt Templates for GD&T and Tolerance Analysis
The following templates are structured for Claude or ChatGPT. Replace [BRACKETED] items with your specific data.
Template 1: GD&T Feature Control Frame Interpretation
Interpret the following GD&T feature control frame to [ASME Y14.5-2018 / ISO 1101:2017]. Feature control frame: [DESCRIBE PRECISELY IN TEXT: geometric characteristic symbol, tolerance value, material condition modifier if any, datum references in sequence]. Feature described: [DESCRIBE THE FEATURE: type (hole, surface, slot, pin), nominal size if feature of size, location on the part]. Provide: (1) The geometric characteristic being controlled (what property of the feature is constrained). (2) The tolerance zone geometry: shape, size, and location.
(3) If a material condition modifier is present: the MMC/LMC size of the feature, the bonus tolerance available at LMC/MMC, and the total position tolerance at LMC/MMC. (4) The virtual condition. (5) How the datum reference frame would be established physically (which surface contacts which datum simulator first, second, and third). (6) The most appropriate inspection method (functional gauge, CMM, or hand measurement) and why. (7) Any aspect of this callout that is ambiguous or potentially incorrect.
Template 2: Tolerance Stack-Up (Worst-Case and RSS)
Perform both worst-case and RSS tolerance stack-up analyses for the following assembly gap. Critical gap: [DESCRIBE: e.g. axial clearance between shaft shoulder and housing bore step]. Acceptance criterion: gap must always be positive (no contact) / gap must be in range [MIN to MAX]mm. Production volume: [QUANTITY/year] (for RSS appropriateness recommendation). Dimensions in the stack-up loop (positive direction = opens the gap; negative direction = closes the gap): [LIST EACH: Description, Nominal value mm, Bilateral tolerance +/- mm, Direction (+/-)]. For RSS analysis, assume all tolerances are 3-sigma limits (Cp = 1.0) with normal distributions unless stated otherwise. Provide:
(1) Worst-case: mean gap, total variation, minimum and maximum gap, pass/fail against criterion. (2) RSS: mean gap, RSS combined variation, minimum gap at 3-sigma (99.73%), minimum gap at 6-sigma, statistical yield if minimum = 0. (3) Dominant tolerance (largest single contributor to both worst-case and RSS variation). (4) Recommendation: is worst-case or RSS more appropriate for this application and volume? (5) If worst-case fails: which single tolerance tightening achieves worst-case compliance at minimum cost increase?
Template 3: ISO Fit Selection and Thermal Analysis
Select an appropriate ISO 286 fit and perform a thermal expansion analysis for the following shaft-and-bore assembly. Nominal diameter: [VALUE]mm. Assembly function: [DESCRIBE: e.g. shaft rotates continuously in bore at 1,500 rpm with moderate radial load; must be removable for maintenance]. Shaft material: [MATERIAL, CTE value x10-6/K]. Bore material: [MATERIAL, CTE value x10-6/K]. Temperature range: [MIN]C to [MAX]C. Installation temperature: [VALUE]C (typically 20C). Provide:
(1) Recommended ISO fit designation (shaft tolerance class / hole tolerance class) with justification based on the assembly function. (2) Numerical clearance or interference range at the recommended fit at installation temperature (state the shaft and hole tolerance values in micrometres). (3) Thermal expansion of shaft and bore at temperature extremes. (4) Total diametral clearance or interference at MIN temperature and MAX temperature. (5) Does the fit remain in the intended category (clearance/transition/interference) across the full temperature range? (6) If the fit changes category at any temperature, state the transition temperature and recommend an alternative fit designation.
Template 4: Datum Reference Frame Assessment
Assess the following datum reference frame for the described part and its assembly context to [ASME Y14.5-2018 / ISO 1101:2017]. Part description: [DESCRIBE PART GEOMETRY AND FUNCTION]. Assembly context: [DESCRIBE HOW THIS PART LOCATES IN THE ASSEMBLY, which surface contacts which mating feature first, second, and third]. Drawing DRF: Datum A: [DESCRIBE FEATURE TYPE: e.g. the 150x80mm bottom flat face]. Datum B: [DESCRIBE: e.g. the 25mm diameter precision bore on the left side]. Datum C: [DESCRIBE: e.g. the flat face on the front side]. Questions:
(1) For each datum, state: the datum feature type, how many degrees of freedom it constrains, and which specific degrees of freedom. (2) Are all 6 degrees of freedom constrained? Are any degrees of freedom over-constrained? (3) Does the DRF datum sequence match the physical assembly contact sequence? If not, describe the mismatch and its consequence for the GD&T callouts that reference this DRF. (4) Is this DRF physically realisable for CMM inspection without ambiguity? (5) Recommend any changes to the datum selection or sequence that would better represent the functional assembly context.
Template 5: CMM Measurement Plan Generation
Generate a CMM measurement plan for the following part and its GD&T callouts. Part: [NAME AND DESCRIPTION]. Material: [MATERIAL]. Datum reference frame: [DESCRIBE A, B, C datums]. GD&T callouts to measure: [LIST ALL: geometric characteristic, tolerance value, modifier, datum references, feature location]. CMM available: [DESCRIBE: e.g. bridge CMM with 1mm ruby probe, manual fixturing, PC-DMIS software]. For each GD&T callout:
(1) State the minimum number of probe points required for this control type. (2) State the recommended number of probe points for the specified tolerance (tighter tolerances require more points). (3) Describe the probe approach direction for each feature. (4) Describe any fixturing requirement to establish this datum. For the complete measurement plan: (5) Propose a measurement sequence that establishes datums first, then measures all features in an efficient order minimising probe travel and part repositioning. (6) Identify any callout that cannot be verified with the stated CMM configuration.
GD&T AI Accuracy: What LLMs Get Right and Where to Verify
| GD&T Topic | LLM Accuracy Level | Key Accuracy Notes | When to Independently Verify |
| Simple feature control frame interpretation (flatness, position, perpendicularity, runout) | High (90%+) | Well-defined rules in both ASME and ISO; LLM applies consistently when standard is specified | Always verify when used in regulated or safety-critical applications; spot-check 20% of LLM interpretations against the published standard |
| MMC/LMC bonus tolerance calculation | High (95%+) | Arithmetic calculation from defined rules; LLM calculates departure from MMC and bonus tolerance correctly in almost all cases | Verify the first time for each callout type; arithmetic is reliable but input description must be precise |
| Worst-case and RSS stack-up calculation | High (90%+) | Well-defined mathematical procedure; LLM performs correctly when all inputs are provided precisely; errors most likely from ambiguous input description | Verify all stack-up calculations that will be used in formal engineering documentation; independent hand calculation or Excel check |
| Composite position callout (PLTZF/FRTZF) | Moderate (70%) | Nuanced interpretation involving two simultaneous tolerance zones; one of the most frequently misinterpreted GD&T callouts by humans and AI | Always verify composite position interpretations against ASME Y14.5-2018 Section 7.5; this is a high-risk LLM interpretation area |
| ISO 286 fit numerical values | Moderate-High (80%) | LLM knows the ISO 286 fundamental deviation system but may have outdated or rounded values for specific tolerance classes | Verify all ISO 286 numerical values (shaft and bore tolerance limits in micrometres) against the current ISO 286-1 standard table before use in manufacturing specification |
| Datum reference frame adequacy assessment | Moderate (75%) | LLM applies the DOF constraint logic correctly for standard datum types; may misassess complex DRFs with partial surfaces or offset datums | Verify DRF assessments for complex geometries; the physical fixturing implication of the DRF should always be checked by a metrologist |
| Unilateral and non-uniform profile tolerance | Moderate (65%) | Profile of a surface with unilateral or non-uniform tolerance zones is complex; LLM may apply the standard bilateral interpretation | Always verify unilateral and non-uniform profile interpretations explicitly; specify ‘non-uniform profile’ in the prompt and verify against ASME Y14.5-2018 Section 8 |
| 3D statistical tolerance analysis | Low (not capable) | LLMs cannot perform 3D geometric variation analysis; they can set up the problem and identify the analysis approach but cannot execute the simulation | Use 3DCS, CETOL, or equivalent specialist software for 3D tolerance analysis; LLM provides setup guidance only |
Frequently Asked Questions (FAQ)
How can AI help with GD&T and tolerance analysis?
AI helps with GD&T and tolerance analysis by interpreting feature control frames, checking datums, calculating tolerance stack-ups, selecting fits, reviewing drawings, and generating CMM inspection plans. Tools like 3DCS and CETOL provide advanced 3D statistical analysis, Monte Carlo simulation, and tolerance optimisation.
Can AI perform tolerance stack-up analysis?
LLMs like ChatGPT and Claude can calculate 1D and 2D worst-case and RSS tolerance stack-ups when given complete dimension and tolerance data. For complex 3D variation simulations, specialist tools like 3DCS, CETOL 6 Sigma, or SolidWorks TolAnalyst are required.
What is the difference between ASME Y14.5 and ISO 1101 for AI GD&T interpretation?
ASME Y14.5-2018 and ISO 1101:2017 differ in modifier rules, concentricity and symmetry controls, envelope requirements, and datum interpretation. When using AI for GD&T review, specify the applicable standard and verify complex or uncommon callouts against the official standard.
How accurate is AI for GD&T interpretation?
LLMs interpret simple GD&T callouts more reliably than complex ones. Use them for learning and preliminary reviews, but verify all critical interpretations against ASME Y14.5 or ISO 1101, or with a qualified GD&T professional.
What AI tools are available for tolerance analysis?
Key AI tolerance analysis tools include 3DCS Variation Analyst and CETOL 6 Sigma for 3D statistical analysis, SolidWorks TolAnalyst for linear stack-ups, and GD&T Advisor for drawing checks. ChatGPT and Claude offer accessible first-pass GD&T interpretation and basic tolerance calculations, but critical results require engineering verification.
Can AI generate a CMM measurement plan from a drawing?
LLMs can draft CMM measurement plans by defining datum sequences, probe points, approach directions, and measurement order. They can also flag limitations in CMM capability, but a qualified metrologist or CMM programmer should verify the plan before implementation.
How does AI handle MMC and LMC bonus tolerance calculations?
LLMs can calculate MMC/LMC bonus tolerances by determining the feature’s departure from its material condition limit and adding the bonus to the specified tolerance. They can also assess pass/fail results, but complex cases involving composite tolerances or special modifiers require independent verification.
Conclusion
GD&T and tolerance analysis are the engineering disciplines that sit at the boundary between design intent and manufacturing reality. Applied correctly, GD&T maximises the tolerance available to manufacturing while guaranteeing assembly function. Applied incorrectly, it produces drawings that are either unmanufacturable (tolerances tighter than any process can achieve) or assembly-unsafe (tolerances that allow non-functional combinations). Tolerance stack-up analysis ensures that the combination of reasonable individual tolerances does not produce an unreasonable assembly outcome. These are not academic exercises, they determine whether a product works and can be made economically.
AI is making the systematic application of GD&T and tolerance analysis accessible to every design engineer, not just those with formal GD&T training or access to specialist tolerance analysis software. LLM-based GD&T interpretation means that every engineer who encounters an unfamiliar callout can get an accurate explanation in seconds rather than hunting through a standard. LLM-based stack-up analysis means that every critical assembly gap can be checked before manufacturing commitment rather than only the ones where the schedule allows a specialist to be involved. LLM-based DRF assessment means that the datum sequence on every drawing can be evaluated for functional correctness, not just structural completeness.
The combination of LLM accessibility with specialist tool rigor, LLMs for interpretation, reasoning, and 1D analysis; 3DCS and CETOL for 3D statistical variation, provides a complete AI-assisted tolerance engineering workflow that is better and faster than purely manual practice at every level of complexity. Implement the LLM prompt templates in this article immediately. Add specialist tolerance analysis tools when the assembly complexity or regulatory requirement justifies the investment. The result will be fewer assembly problems, fewer first article failures, fewer manufacturing queries about drawing ambiguities, and fewer tolerance-related ECOs, which is to say, better engineering.
Related Reading: How Engineers Use AI to Review CAD Models Faster | Using AI to Detect Design Errors Before Manufacturing | AI-Assisted Design Reviews for Mechanical Engineers | 50 Claude Prompts for Mechanical Engineers | 3D Modeling in CAD: The Complete 2025 Guide
Leave a Reply