The question most engineering managers ask when considering 3D scanning for reverse engineering is not whether it produces better geometry. Most engineers accept that answer without much debate. The real question is whether it justifies the investment: the capital cost of the scanner, the software license, the training time, and the ongoing operational overhead. Does all of that add up to a lower total cost than having a skilled engineer measure the part and model it by hand?
The honest answer: it depends on part complexity, project volume, quality requirements, and whether you are building in-house capability or using a service bureau. For simple prismatic parts at low volumes, manual modeling is often cheaper. For complex organic geometry, worn legacy parts, large variant families, or regulated applications requiring measurement traceability, scan-to-CAD is typically both faster and cheaper in total cost, and qualitatively superior.
This article builds the cost model that makes that decision quantitative rather than intuitive. It maps every cost element of both approaches, builds seven scenario-specific comparisons with realistic hour and dollar estimates, identifies the crossover point at which scanning becomes economically dominant, and provides a breakeven calculator for in-house scanner investment.
What Manual Modeling Actually Costs: The Full Picture
Manual modeling for reverse engineering is deceptively simple to estimate at the surface level: an engineer measures a part and builds a CAD model. The visible cost is the engineer’s time. But the full cost includes several elements consistently overlooked in informal comparisons, producing estimates significantly lower than reality.
The Measurement Phase: More Time Than It Looks
Manual measurement of a complex mechanical part is not quick. A simple prismatic bracket with ten defined features might take 30 to 60 minutes to measure thoroughly with calipers, depth gauges, and a surface plate. A complex casting with curved surfaces, multiple angled features, and critical bore-to-bore relationships might take 4 to 8 hours of careful measurement, often requiring CMM time for spatial relationships handheld tools cannot capture reliably.
Engineers consistently underestimate measurement time for two reasons. First, the initial pass captures obvious dimensions, and subsequent CAD modeling reveals dimensions that were not initially measured, creating back-and-forth between physical part and CAD that adds 20 to 50 percent to total measurement time. Second, complex geometry requires multiple fixture setups to reach features from different orientations.
The Modeling Phase: Where Complexity Multiplies Cost
For a simple prismatic part, an experienced engineer might spend 2 to 4 hours in CAD. For a complex casting with organic geometry, rib structures, and multiple angled bosses, the same engineer might spend 20 to 40 hours, because complex geometry requires reasoning about design intent behind every measurement: which surfaces are nominally flat, which radii are standard nominal values, which surfaces are true freeform curves? Getting this wrong produces a model reproducing worn or imprecise geometry rather than original design intent.
The Hidden Cost of Manual Measurement Errors
The most significant hidden cost in manual modeling is the error rework cycle. Manual measurement introduces errors at every step: misreading a caliper, misidentifying the datum surface, transposing a recorded value. These errors propagate into the CAD model and are typically not discovered until the model is used to manufacture a part that does not fit.
The rework cost when an error reaches manufacturing includes the incorrectly manufactured part (material, machining time, setup), the schedule delay while the error is diagnosed, and potentially production downtime costs. For a machined part with a three-day lead time, a measurement error adds three to five days to the project timeline plus the full cost of the first-off part, typically $500 to $5,000 depending on material and complexity.
| Manual Modeling True Cost FormulaTotal manual cost = Measurement time + CAD modeling time + Quality check time + (Error probability x Expected rework cost). The error probability and rework cost are consistently omitted from informal comparisons. For complex parts with many interrelated dimensions, a 20 to 30 percent error rate requiring significant rework is not unusual. Including probability-weighted rework typically increases true manual modeling cost by 25 to 50 percent over a best-case estimate. |
What Scan-to-CAD Actually Costs: Beyond the Scanner Price Tag
The most common objection to scan-to-CAD investment is the capital cost. This is real, typically $15,000 to $80,000 for a quality structured light system, plus $3,000 to $12,000 per year for reconstruction software. But focusing on capital cost in isolation misrepresents the economics, because this cost is amortized across every part the system processes over its operational life.
Amortizing the Capital Cost
A structured light scanning system has a practical operational life of 5 to 8 years with regular calibration. Divided over 5 years, a $40,000 scanner costs $8,000 per year in capital amortization. At 100 parts per year the scanner adds $80 of capital cost per part. At 400 parts per year, it adds $20. These numbers are negligible relative to engineer labor cost for any part of moderate complexity.
Software at $6,000 to $8,000 per year adds $15 to $80 per part at the same volumes. Consumables add approximately $5 to $20 per part. Total non-labor overhead per part ranges from $40 at high volume to $180 at low volume, both well within the labor savings for anything beyond the simplest parts.
Scan-to-CAD Labor: Where the Real Savings Appear
The scan capture phase typically takes 0.5 to 2 hours for a medium-sized industrial part across 6 to 15 scan positions. This compares to 1 to 8 hours of manual measurement for the same part, with the scan capturing more complete geometry without back-to-the-part re-measurement cycles.
The reconstruction phase using scan-guided CAD modeling in tools like Geomagic Design X is genuinely faster than equivalent manual parametric modeling for complex geometry. For simple prismatic parts, the time saving is small. For complex castings and organic forms, scan-guided reconstruction can be 50 to 70 percent faster than equivalent manual modeling because the engineer is tracing known geometry rather than reasoning about unmeasured surfaces.
Quality Verification: The Comprehensive Advantage
Deviation analysis, comparing the reconstructed CAD model against the original scan data, takes 1 to 3 hours for a thorough review. This has no direct equivalent in manual modeling, where verification typically means re-measuring a subset of critical dimensions. The scan verification is more comprehensive: it checks every surface simultaneously, rather than a spot-check of selected features.
This also provides a downstream asset: the scan data serves as a permanent archive of the physical geometry at the time of scanning. If questions arise months later, the scan data can be re-examined without physical access to the original part. Manual modeling produces no equivalent record.
Complete Cost Breakdown: Every Element Side by Side
The following table maps every significant cost element of both approaches with realistic ranges. All labor costs assume $100 to $150 per hour, reflecting mid-range senior engineering costs in most North American and European markets.
| Cost Element | Manual Modeling | Scan-to-CAD | Notes |
| Capital equipment | $0 (uses existing CAD tools) | $15,000-$80,000 (structured light scanner + software) | Amortized over 3-5 year lifespan at 50-400 parts/yr |
| RE software license | $0-$2,000/yr (CAD only) | $3,000-$12,000/yr (Geomagic Design X, PolyWorks) | Some scanning included in CAD package extensions |
| Consumables per part | $0 | $5-$20 (scanning spray, calibration artifact wear) | Low per-part cost; spray covers many scan sessions |
| Measurement tooling | $200-$2,000 (calipers, height gauges, CMM time) | $0 for general surface; CMM still for threads/precision | CMM still needed for thread and H7/H6 fit verification |
| Data capture labor | 1-8 hrs (manual measurement and sketching) | 0.5-2 hrs (scan setup, capture, registration) | Scan captures comprehensive geometry; manual is selective |
| CAD reconstruction labor | 4-40 hrs (fresh parametric build from notes) | 3-20 hrs (scan-guided reconstruction) | Scan provides dimensional reference throughout; faster for complex parts |
| Quality verification | 0.5-4 hrs (spot-check re-measurement) | 1-3 hrs (comprehensive automated deviation analysis) | Scan checks entire surface; manual checks selected dimensions only |
| Rework risk | High – errors propagate silently to model | Low – errors visible immediately in deviation map | Manual errors typically found only at first-off manufacturing |
| Error rework cost (when occurs) | 4-20 hrs (re-measure, re-model affected sections) | 1-4 hrs (re-examine scan data, update model) | Scan data archived; no physical part access needed for re-check |
| Documentation package | Engineer notes only – minimal audit trail | Scan + deviation report = full traceable audit trail | Critical difference for aerospace, medical, and regulated applications |
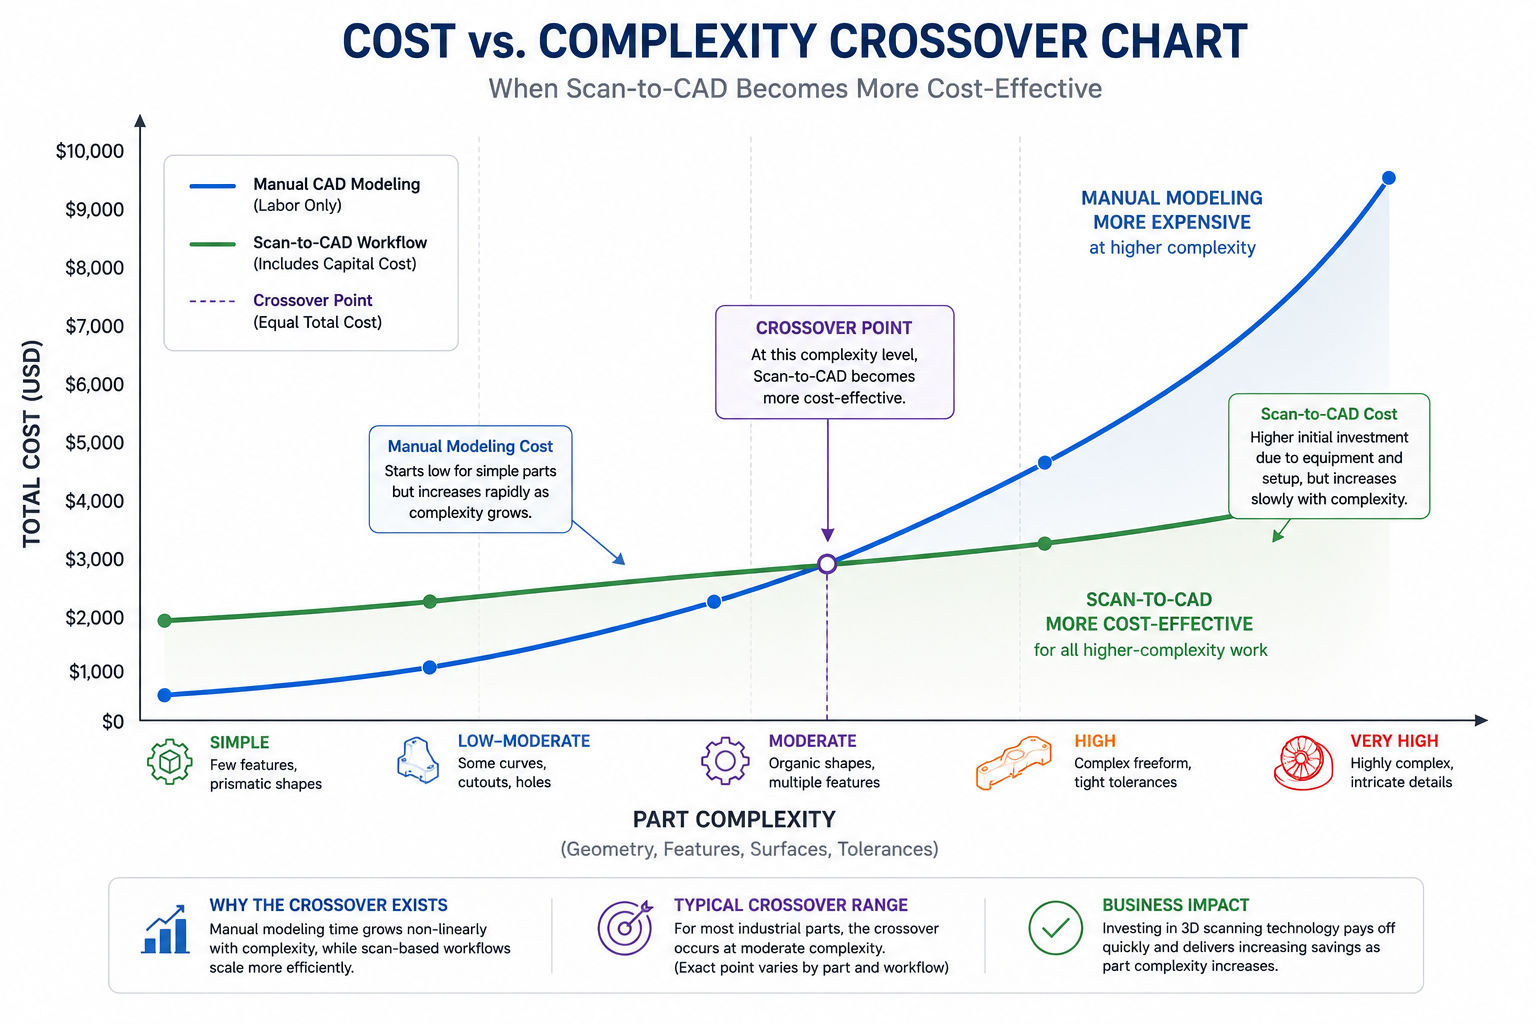
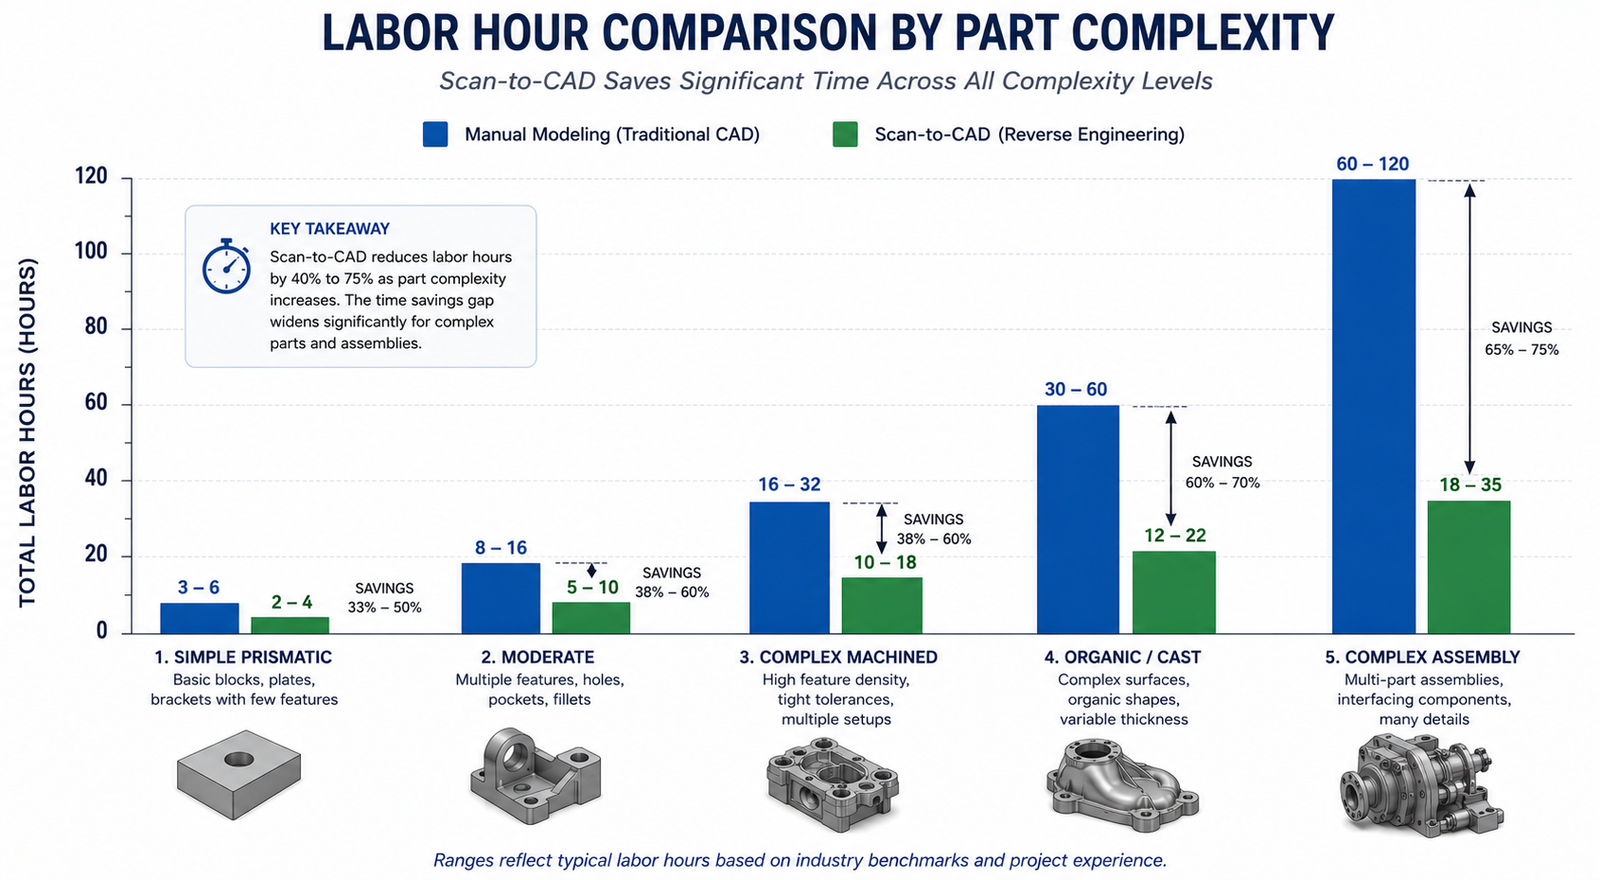
The key observation: the two approaches have similar per-part costs for simple parts but diverge dramatically as complexity increases. The scan approach’s labor time scales more slowly with complexity because the scanner captures full geometry regardless of how complex the part is, while manual measurement time scales nearly linearly with geometric complexity.
Scenario Analysis: Seven Real-World Cost Comparisons
The following seven scenarios cover the range of reverse engineering situations engineering teams typically encounter, from the simplest part where manual modeling wins to the complex assembly where scanning wins decisively.
| Scenario | Complexity | Manual Total | Scan-to-CAD Total | Cost Winner | Quality Winner |
| Simple prismatic bracket, well-documented | Low | $450-$900 | $600-$1,200 (incl. scanner amortization) | Manual | Tie |
| Complex organic component, no drawings | High | $3,000-$9,000 (high error risk) | $1,500-$3,500 | Scan-to-CAD (2-3x cheaper) | Scan-to-CAD |
| Worn legacy part, design intent uncertain | Med-High | $2,000-$6,000 + rework risk | $1,200-$2,500 | Scan-to-CAD clearly | Scan-to-CAD |
| Precision machined part, H7/H6 fits | Medium | $900-$2,400 | $1,400-$2,800 (CMM hybrid needed) | Tie or Manual | CMM hybrid |
| Family of 10 size variants | Med x10 | $4,500-$9,000 | $2,000-$4,000 (scan one, table for variants) | Scan-to-CAD strongly | Scan-to-CAD |
| Single one-off, simple geometry | Low | $300-$600 | $800-$1,500 (overhead dominates) | Manual | Tie |
| Assembly of 15 interacting parts | High | $15,000-$45,000 | $5,000-$12,000 | Scan-to-CAD (3-4x cheaper) | Scan-to-CAD |
The most important pattern: for simple single parts, manual wins on cost. From moderate complexity onward, and for any scenario involving multiple related parts, scan-to-CAD wins because labor savings compound while capital cost per part decreases with volume. The quality column is consistent: scanning wins for virtually every scenario beyond the simplest, because deviation analysis verifies the entire model comprehensively.
The Crossover Point: When Does Scanning Pay Off?
The crossover is a function of three variables: part complexity (determines per-part labor saving), project volume (determines capital cost amortization per part), and quality requirements (determines whether scan verification’s comprehensive documentation has additional financial value).
Complexity-Based Crossover
At 50 parts per year, scanning becomes cost-competitive at moderate complexity: roughly 20 to 50 geometric features and several organic surfaces, corresponding to approximately 10 to 20 hours of manual modeling time per part. Parts below this threshold are generally cheaper to model manually. Parts above it are almost always cheaper with scanning, often dramatically so for the most complex cases.
Volume-Based Crossover
At constant moderate complexity, each part generates roughly $500 to $1,000 in labor savings from scan-assisted modeling at $125 per hour. A $40,000 scanner with $8,000 per year software has a total annual cost of $16,000. At $750 per part average savings, the annual breakeven volume is 21 parts per year, fewer than two parts per month. This is achievable for any organization doing regular reverse engineering work. Above this volume, every additional part generates pure financial benefit.
Quality Requirement Crossover
For regulated industries, the crossover improves further because the scan verification report is a compliance asset with quantifiable financial value that reduces regulatory risk and supports quality management system audits. Including the avoided cost of alternative CMM inspection programs significantly improves scanning economics even for simpler parts in these contexts.
The Breakeven Calculator: Building Your Own Business Case
The following framework provides a structured calculation for determining the financial return on investment from a scan-to-CAD program. Adapt the numbers to your actual labor rates, scanner quotation, and part mix.
Scan-to-CAD ROI Calculator Framework |
The most important sensitivity is the average complexity of your part mix. Teams primarily dealing with complex parts find this calculation strongly favorable even at modest volumes. Teams primarily dealing with simple prismatic parts find the breakeven higher and may be better served by accessing scanning as a service for the minority of parts that justify it.
In-House Scanning vs. Scanning as a Service
For organizations with lower volumes or highly variable project requirements, accessing 3D scanning as a service from specialist bureaus provides the quality benefits of scanning without capital investment. Understanding when each model makes sense is as important as understanding when scanning makes sense at all.
The Service Bureau Model
3D scanning service bureaus typically charge $150 to $500 per part for scan capture and mesh delivery, or $800 to $3,000 per part including full parametric reconstruction, depending on complexity and turnaround. At these rates, service bureau scanning is cost-effective for organizations doing fewer than 10 to 15 scan projects per year, or for organizations with occasional high-complexity parts within a general part mix too simple to amortize in-house equipment.
When In-House Investment Is Clearly Better
In-house scanning is the better economic choice when: the annual part volume exceeds the breakeven (typically 15 to 50 parts per year depending on complexity), when turnaround time is critical to operations, when parts are sensitive or proprietary and cannot leave the facility, or when the organization wants to develop internal scanning capability as a strategic asset. The hybrid model works well for many organizations: in-house for the majority of parts, service bureau for occasional projects requiring specialized technology.
Quality-Adjusted Cost: The Dimension Pure Cost Analysis Misses
A cost comparison looking only at labor hours and capital costs misses a genuinely important dimension: quality-adjusted cost, which accounts for the value of the quality difference between the two approaches and the cost implications of that difference over the part’s operational life.
The Verification Coverage Difference
Manual modeling produces a CAD model with spot-checked quality assurance where a subset of dimensions have been verified against the physical part. Scan-to-CAD produces a model with comprehensive surface verification through deviation analysis: every surface compared against measurement data simultaneously, rather than a spot-check of selected features.
For a replacement part that must function correctly in production equipment, a part manufactured from a spot-checked manual model carries higher residual risk of fit and function failure than one from a scan-verified model. If that residual risk materializes, the cost of the failure can easily exceed the entire cost of the original reverse engineering program.
The Documentation Value in Regulated Environments
In regulated industries, the scan data and deviation analysis report are valuable engineering documents supporting regulatory compliance, quality management system audits, and litigation defense. A manual modeling process produces essentially no documentation of the measurement process. A scan-to-CAD process produces a complete traceable chain of evidence that can be reproduced and audited years later. For pharmaceutical equipment, medical devices, aerospace components, and other regulated products, this traceability is a financial asset that reduces regulatory risk and audit response costs.
Frequently Asked Questions
Q: Is scan-to-CAD faster than manual modeling?
For complex parts, yes, significantly. For simple prismatic parts, the difference is small or nonexistent and manual modeling may be marginally faster. The time advantage grows with complexity because the scanner captures complete geometry regardless of how complex the part is, while manual measurement time scales nearly linearly. For a complex casting taking 30 to 60 hours to measure and model manually, scan-guided reconstruction typically takes 10 to 22 hours, a two to three times reduction. For a simple bracket taking 4 hours manually, scanning saves roughly 1 hour, not enough to justify scanner capital cost on a single part.
Q: How much does 3D scanning for reverse engineering cost?
In-house structured light scanning equipment costs $15,000 to $80,000 for the scanner, plus $3,000 to $12,000 per year for professional reconstruction software. Amortized over 5 years at 50 to 100 parts per year, non-labor overhead per part is approximately $100 to $350. Scanning as a service costs $150 to $500 per part for scan capture and mesh delivery, or $800 to $3,000 per part including full parametric reconstruction, depending on complexity and turnaround requirements.
Q: What is the breakeven volume for investing in a 3D scanner for reverse engineering?
For a mid-range structured light scanner ($40,000) with professional reconstruction software ($7,000 per year) applied to moderately complex parts (15 to 20 hours manual modeling time), the typical breakeven volume is 14 to 25 parts per year. At 50 parts per year, a typical in-house scanning program generates $40,000 to $80,000 of net annual benefit beyond equipment cost.
Q: When should I use manual modeling instead of scan-to-CAD?
Manual modeling is the better choice when: the part is simple and prismatic with fewer than 10 hours of expected modeling time, project volume is too low to amortize scanner investment and service bureau pricing would exceed the manual labor cost, the part has a surviving original drawing providing complete dimensional information, or critical features are threads and precision bores requiring CMM hybrid measurement regardless of scanning approach.
Q: Does 3D scanning produce better CAD models than manual modeling?
For complex geometry, yes. Scan-to-CAD models are dimensionally referenced against comprehensive scan data throughout reconstruction, and the completed model is verified against scan data through deviation analysis. This produces a model with documented, verifiable accuracy across every surface. Manual modeling produces a model with spot-checked accuracy on selected dimensions. For simple prismatic parts, the quality difference is smaller, but the documentation advantage of scan-to-CAD remains significant for regulated applications.
Q: How do I calculate the ROI of a 3D scanner for my engineering team?
Calculate average manual modeling hours per part (measurement plus CAD plus verification plus estimated rework). Calculate expected scan-to-CAD hours per part. Multiply the difference by your fully loaded engineer labor rate to get value per part. Divide total annual scanner cost (amortized capital plus software plus consumables plus training) by value per part to get breakeven volume. If projected annual part volume exceeds breakeven, the investment is financially justified. Also include the quality value of comprehensive scan verification if your application is in a regulated industry.
Conclusion:
The cost comparison resolves into a clear framework once all relevant cost elements are accounted for. For simple parts at low volumes, manual modeling is typically cheaper because scanner overhead is not recovered from modest labor savings on straightforward geometry. For complex parts, high volumes, families of related parts, or applications with quality documentation requirements, scan-to-CAD is typically both cheaper in total cost and better in quality.
The two insights that most change how engineering managers approach this decision: first, manual modeling’s true cost includes error rework risk that is frequently omitted from informal comparisons. Second, the scan verification report is a financial asset, not just a technical product, because it reduces regulatory risk, supports quality management system audits, and provides a permanent archive proving the CAD model was correctly derived from the physical part.
Run the breakeven calculation with your own numbers. The breakeven volume for most organizations doing moderately complex reverse engineering falls at 15 to 25 parts per year, a threshold many engineering teams exceed in their first month of a serious RE program. The financial case is usually not as close as it appears before the full cost model is built.
Complete your reverse engineering decision framework with our guides on the scan-to-CAD workflow, common scan-to-CAD challenges, accuracy requirements by application, and the industries currently using reverse engineering at scan.
Leave a Reply